Any indication from concensus of met models for a potential flood-level surge in the English Channel , in the next few days, from my widget detailed below, prior to the pro NTSLF output. Emailed to those in the low-lying ( Belsize flood action group/ St Denys flood action group) , wider Solent and Christchurch areas, in the circulation list , as neither the Environment Agency, nor NTSLF gives advisories prior to their outputs or even , a priori, error bars from the statistics of previous significant surges/floods predictions and actuality. Anyone in similar circumstances in the Portsmouth, Langstone, Poole areas etc, is welcome to join, as the surge component tends to be much the same with timing relative to your local high tide as for the largest surges in the case of west-to-east surges, my email details below.
Because of national significance and 2 researchers at NOC/Liverpool/Proudman are looking into this.
Change in AMOC leading to recent change in mean sea level around the UK ?
Not just Newlyn to Jersey to Dover but Millport, Whitby and Stornoway the tide residuals in recent years are all high by 0.1m or more.
eg for Pompey
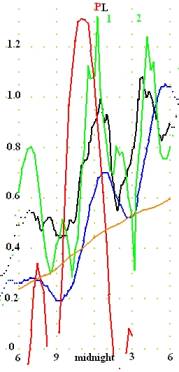
https://ntslf.org/storm-surges/latest-surge-forecast?port=Newlyn&chrt=3
If all was well at all UK ports, the red residual should track the blue of the NTSLF surge predictor, (luckily no problem with that surge prediction component).
In 2019 it became noticeable that locally the underlying tide predictions were too low. Now it is getting impossible for local extreme potential flood surge tide predictions . So even the EA is failing to give warnings for Pompey and Soton, when actuality is higher than their trigger warning levels, because they are using too low tide predictions.
As a lockdown project ,very time consuming , I constructed a 260 harmonic-constant tidecurve for Southampton and later one for pompey, using what is now 3700 datapoints , curve fitting 8 of 2*260 parameters at a time.
Assuming the NTSLF tide predictions are all about ok for the dynamic range of the tides then leaves an umet offset of mean sea level rise around the UK recently, to bring those blue and red lines into valid QC territory.
In linear terms I need about 2cm a year since 2020 to continue including sea level rise in my 3.5 year long data set, for a continuous Belsize tide curve.
The 18.613 and 8.848 year harmonic constants don't have enough realistic amplitudes to cover that sort of rise in 3 to 4 years.
Best fit is a power function of power approx 1.6 rather than linear, giving an extra, over global SLR and local geological isostatic adjustment, each year
2021.0 , 2.4cm
2022.0, 6.2cm
2023.0, 11.0cm
2024.0, 16.4cm
...
2030.0, 49cm !!!!!!
Hopefully something of a short term one-off or cyclic process is going on in the last few years around the UK, like the USA east coast 6 inch rise in local tide gauge readings there. Perhaps for the NE Atlantic,
due to a slowing of AMOC, the return cold current is no longer able to pass south at depth and is piling up. Extra weight of sea water around the UK increasing the post-glacial sinking? Abstraction of North Sea oil and gas causing the UK to sink? Warming of NE Atlantic water to depths causing density change? Change of position of Gulf Stream relative to the UK?
I'm going with excess freshening/reducing salinity as the
cause, from Baltic freshwater inflow and Greenland runoff. See the paper
Dye, S., Berx, B.,Opher, J., Tinker, J.P. and Renshaw, R. (2020) Climate change and salinity of the
coastal and marine environment around the UK. MCCIP Science Review 2020, 76�102.
Also observations that this anomaly goes up when a lot of rain falls over NW Europe and
decreases with storminess near the UK mixing in deeper saltier water
andgoes down when there is an extended high pressure over the whole of Europe ie exceeding the UK onlysection considered by NTSLF . Until the source of this
anomaly is known then it�s impossible to say whether its temporary, increasing or decreasing.
I now have a widget for extracting csv files from the
https://ntslf.org/storm-surges/latest-surge-forecast?port=Portsmouth&chrt=3
png files, for the red and blue data.
So for the quiet weather period around neutral NTSLF surge prediction, 17 to 19 June 2023.
Offset cumulative average for NTSLF pompey "1.3" over those 3 days 0.151m
Offest for Lymington cumulative average residual for 17-19 June was 0.152m
Offset for Belsize tidecurve for that period 0.135m, ie unaccounted for by global sea level rise and local geology effect.
With luck it will be possible to see, week by week/monthly, whether the ?AMOC? UK mean sea level offset is rising ,falling or static. For the moment Belsize has, built-in, a rising offset, until the next time I need to re-optimise the harmonics ,due to any noticeable consistent diverging from reality (EA1034 minus plausible quiet weather residuals / inverse barometer only).
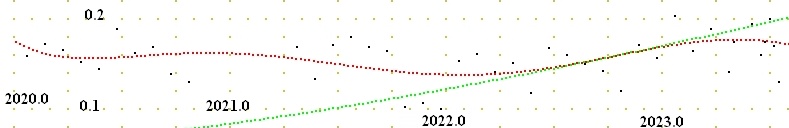
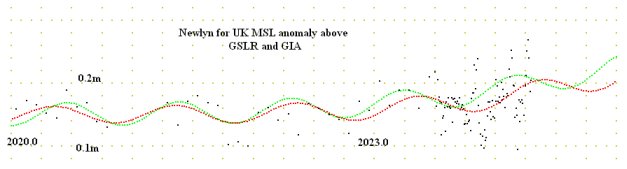
Very much a scatter plot, best fit for all that is hextic polynomial is the red line, the green is the factor I've had to add to the Belsize curves because this MSL offset was exceeding any conceivable long period, > 1 year , harmonic constants to account for all this.
For the UK MSL offset, analysing NTSLF Newlyn "1.3" 3 day plots
to 23 July 2023, the peak was 06 May of 0.179m and rise over the year to then of 3.9 cm, after that to 23 July a drop of 7.2mm or 2.5mm/month, Belsize overplaying by 3cm end of Aug 2023.
to 26 July 2023 , the peak was 06 May of 0.177m and rise over the year to then of 3.7 cm, after that to 26 July a drop of 4.3 mm or 1.6mm/month , Belsize overplaying by 3cm end of Sept 2023, peak flattening so maybe disappearing to continued rising in the next months.
Apparent peak probably due to meteorology etc and stochastic stuff and has since disappeared in the curve fitting , along with May and June NTSLF Newlyn "1.3" RMS errors now in their archive, instead of using Pompey data as a stand-in proxy.
Latest result to 03 Sep 2023, the peak is in the future and rise over the year to the present of 1.4 cm, compared to 5.5cm yearly rise in Belsize and potential over-play by 2023 year end of 5cm. Nothing of this potential departure becoming apparent in my weekly 3way "bwu" local QC plots.
This MSL rise may be temporary and will go down again like the recent NE USA coast temporary rise, but as unknown reason for it , this UK MSL rise could be ongoing.
Along with global sea level rise and local south Hampshire sinking giving 6.4mm rise in the last year.
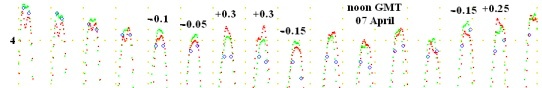
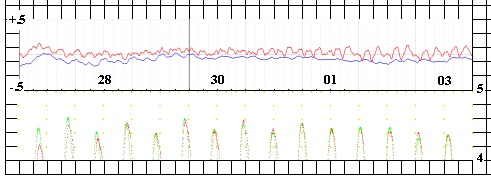
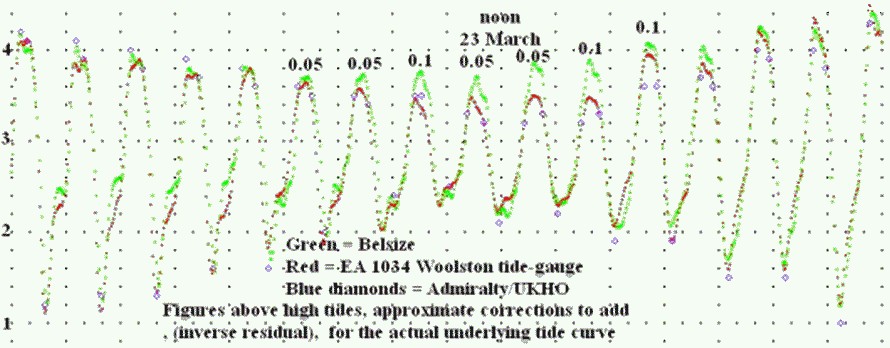
3 way self-evident thumbnail size comparison for Southampton tops of tides 02 April to 09 April 2021, this quality control comparison repeated weekly and independently logged
approximate residuals from an independent source , the Lymington (Channel Observatory values) above the most relevant peaks.
Red = Woolston, Green= Belsize, Blue diamonds= tabulated UKHO, Grey squares = NTSLF tidepred/Soton.
Mentally subtract the signed residual from the tide gauge value
for the underlying tide height. Tan coloured dots are 4 hour
and 0.2m spacing and graticule 12 hour and 1m spacing .
Things got a lot worse in September 2021 as far as Southampton tide predictions are concerned. The Royal Navy/Admiralty/UKHO were only producing one tabulated faux high tide prediction per Soton tide cycle. Perhaps so bad that the 300,000 copies of the 2022 ABP Blue Book Southampton tide tables would not be printed.
So up to 3 hours or about 0.7 metre out for "high tide" predictions and reality accounting for residuals. Still no UKHO explanation of what their single "high tide" dataponts actually represent.
So I'm expanding this comparison facility to a week plus 1 day each saturday or posted a few days later, of the past week and the future week, friday to friday. Grey/tan dots are 0.2m and 4 hour spacing, Green is Belsize tidecurve, blue diamonds UKHO, red is EA Woolston 1034, black is half-houly Belsize tidepoints with , time-for-time , addition of the Lymington residual, continuously for the whole week. So if all was perfect then the black dots should all lie on the red curve, the actual Soton tide. In surge situations, for West-East-going then the more valid Lymington resdual would be the datapoint half an hour before and vice versa for East-West surges. Absent black points are when there is an absence or obvious error in the Lymington file. Hopefully when there is a continuing red and black departure highlighted, the NTSLF Pompey residual could be the referee, pointing to either Lymington or Belsize error.
Lymington tide curve could be in error due to no allowance for weather effects and only might tend to average out over time, and Belsize as only been going for 2 years and only vague syncing of long period harmonics until many years into the process of curve fitting.
8 day span to give one day of overlap as a visual check for simple errors on my part of wrong Julian day/hour or BST/GMT conversion error, wrong decimal hour conversion etc.
Both plots below are always GMT, the horizontal red line is at 2.74m Cd, the empty array for Woolston until updated daily.
For anyone saving the coming week image and comparing to Woolston , my image scaling, for pixel counting, is not constant week to week.
Past week
[ NB EA Eling minus 5cm used instead of EA Woolston data, due to extended outage ]
From 10 June 2023 , 0.15m subtracted from the Lymington residuals ,
then 0.18m June 2024, to compensate for their too low tide curve, still required up to September 2023 and presumably beyond. In the week of 26 July 2024 it looks like the Lymington tide curve had about 0.18m added, so reverted to pre-June 2023 Lymington residual use.
As for the recent NTSLF nonsense, unscrambled in the enclosed graphic by my superimposed black reference line from 29 Aug 2024.
There used to be one consistency in this tidal stuff, calm/quiet weather NTSLF Pompey surge prediction was zero ,within a cm or two , when barometric pressure was 1013 mB and inverse barometer appropriately above and below 1013mB .
IMHO if they had to amend the graphical outputs, then for Pompey add 0.13m to their tide curve for Pompey( so reducing the 'observed' residual by 0.13m) , not add 0.13m to the bigdatasurge predictor values.
Surprisingly I get the same RMS error for Newlyn as their imposed 0.16m jump there. The last 10 , pre-jump, 3 day rms errors average to 0.17m for the last month and my MSL anomaly for Newlyn curve fit going back to 2020.0 gives 0.16m for mid August 2024. Ridiculous having to correct the big data output to beofany use in the real world.
In 2024 the https://coastalmonitoring.org site they've added a page on their recent harmonics and errors.
"The comparisons involve subtracting one year of observations from the predictions for that year and calculating the Root-Mean-Square (RMS) of the differences to estimate average errors."
From that, their RMS error for Lymington is 0.182m and to keep using Lymington residuals in my Solent-wide 4way QC plots I had settled on subtracting 0.18m from their residuals, all very neat and tidy.
So the red (EA Woolston tide gauge) and black (Belsize tidecurve with adjusted Lymington residual) curves end up near enough coincident on the Soton plot.
I would say that most of that 0.18m was to accomodate the recent anomalous mean sea level increase around the UK, over that due to global sea level rise and local post glacial isostatic rebound balance.
The period of bottomed-out trace, Eling -4cm (from recent periods of overlap) while EA Woolston had an outage
ESL
On NTSLF elevated sea level, ESL, evaluations
In the last week ending 08 Feb 2026, with no significant storms, the 1 year return period ESL for Newlyn of 6.16m was exceeded 3 times (6.31m,6.26m, 6.25m) and for Weymouth ESL of 2.75m exceeded 4 times.
My statistics is very rusty but I'd say the probability of that occuring was vanishingly small, more the realm of Winston Churchill view of statistics.
I have a working XL "app" for processing data according to log-Pearson Type 3 frequency distribution, checked valid processing with some published data.
Extracting the monthly highest sea levels from the Woolston EA 1034 tide gauge record for all 2020 to 2025, gives the following return period ESL (elevated sea levels) for Soton
6 month return period, 5.19m
12month/1 year, 5.30m
2 year, 5.39m
5 year, 5.64m
For each month of 2025 only, comparing ESL of EA1034 and pompey EA1028 gives an average difference of 0.153m.( Similar exercise for comparing
EA1034 and Lymington EA1020 gives a difference of 1.51m.)
So simple adding to the Soton values.
For Pompey
6 month return 5.34m
1 year, 5.45m
2 year, 5.54m
5 year , 5.79m
So it looks like the NTSLF Pompey year return ESL of 5.28m is short by the 0.13m "glitch" of 29 Aug 2024. 4cm could easily be accomodated by tide-gauge outages in the record over the 6 years and the skewness fitting of statistical frequency distribution and unknown input data span.
Also looks compatible with the highest Soton ESL of 5.70m 08 Apr 2024 and 5.80m for pompey, simple record heights in 10 year span since the previous record highs of 2014.
Next stop, doing the same difference check between recent Cowes and Soton ESL to use John White of Cowes journal record and Vectis Tavern record plus Coopers Arms epigraphic record, Lt Cdr D H Macmillan record, BODC 1935 to 1990 Soton records to process Soton yearly ESL 1877 to 2025.
The sea level rise component anomaly+global+GIA in metres built into the current Belsize tidecurve for Southampton, with baseline of year 2000
2000 0.0
2005 0.018
2010 0.041
2015 0.067
2020 0.096
2025 0.141
2030 0.196
2035 0.254
2040 0.312
2045 0.372
2050 0.433
For completeness extended to
2100 = 1.092m.
MetO for Southampton in cm based on RCP8.5 95 percentile business-as-usual future
2010 8.007
2020 14.121
2030 21.419
2040 30.263
2050 40.753
2060 52.764
2070 66.541
2080 81.654
2090 98.278
2100 116.107
So not much difference considering Belsize is projecting on from the recent and MetO is presumably working backwards from world climate models of the future. Considering its been various degrees of La Nina from mid 2024 to presumably mid 2026, depressing the future global SLR part of the Belsize curve.
URS table (on itchentides.wordpress.com site) , for data from 1924 to 2009
year return period, Southampton ESL height in metres
2 5.30
5 5.41
10 5.50
20 5.58
50 5.68
100 5.76
200 5.83
500 5.92
Dataset 1924 to 2025 Southampton also GIGO to a lesser extent, some floods recorded in newspapers without any ESL indication, but
includes where there is contemporaneous secondary tide levels reached
when the tide gauge was broken
Return period, ESL
2 5.390
5 5.580
10 5.630
25 5.705
50 5.823
100 6.035
200 6.309
On SLR amplification of ESL return periods.
Assuming the URS table of return periods based on 1924 to 2009 data was valid in 2009 and my return periods based on 1924 to 2025 data using log-Pearson type 3 frequency distribution for main sequence, excluding tails, is valid now.
It seems the academic concensus for the relationship between the ratio of odds for an extreme marine flood event level is an exponential function of the change in sea level.
SLR from 2009 to 2025 much the same for MetO and Belsize of 0.104m.
Noting the URS 2009 return period for ESL of 5.58m was 20 years and mine 2025 for 5.58m was 5 years gives an exponent of 0.612. Going with MetO projected SLR from 2025 to 2040 is 0.127m gives a return period of 4.8 years for 5.58m and amplification factor reduces that to 3.5 years.
Using MetO SLR to 2040
For 5.68m 50 year return period in 2009 and 20 year return by 2025
Out to 2040, 12 year return period for 5.68m .
For 1989 flood level of 5.77m 100 year return in 2009 and 40 year return by 2025, out to 2040, 22 year return period.
For the 1983 flood level of 5.82m , 30 year return by 2040
For 1924 flood level of 6.0m , 23 year return period by 2050.
For a 6.3m level, 65 year return period by 2050
ESL plot from pdf
Coastal storms: detailed analysis of
observed sea level and wave events in the
SCOPAC region (southern England).
which incidently includes reference to my assistance to Ximena Boza MSc thesis.
That Scopac ESL plot Fig 4.3 for pompey extended to 2026, with the same scale as original, only levels above 5.0m plotted as dots.
Using the mid year to mid year , so another 3 months for 2026 to be added.
The outage was for May 2021 to Nov 2022 so more ESL events missing for that period presumably.
I've used green for the 5.23 to 5.47 sector rather than black.
So 13 events in the green " 1 in 1 year", none in 3year and the one Storm Pierrick one in the red.
The 5.28m level was still being used on the revision of the NTSLF plots for Pompey last year for 1 in 1 year, but looks like it should be more like 1 in 4 months return period for pompey.
I won't be updating their residual plots as I don't consider they had an accurate tidecurve to subtract from the tide plots. So exagerated the surge/residuals since the 2015-2017 deep dredging of pompey harbour and probably under assessing the MSL component before that.
To fill in the NTSLF outage, I did a sort of db search on my files for EA data 2021-2022. Unfortunately I did not start Belsize Pompey till May 2022 so for those months only and then the early ones using EA Woolston and adding 0.15m (from average comparison of later Soton & Pompey ESL)
Giving extra ESL events for pompey
5.531m 28 Oct 2022
5.280m 29 Oct 2022
and from Woolston
5.54m 07 Dec 2021
5.38m 18 Feb 2022
None for Apr+May 2026, leaving just June 2026 and possibility of missed events in other short term NTSLF or EA outages.
So tally for the last 6 years (mid to mid) increases to 16 in the green zone and 2 in the red zone, still none in blue .
Or simplistically recently 5.28m pompey return period more like 4.5 months instead of 1 year and 5.53m return period more like 5 years instead of 10 years.
Next week
And because the EA uses NTSLF surge preditions and out-of-date tide-curve for impending flood predictions for Portsmouth and also in conjuction with Bournemouth to infer flood predictions for Southampton.
I've not bothered overlaying green dots or black lines over the combined NTSLF "1.3" images as only the am tide 27 May, a bit exagerated previously, warrants any NTSLF combined total tide for Pompey correction last week, compared to the simple 0.1m correction at high tides.
More detail on the background to this in section called tide letter errors below.
Top pane is the NTSLF "1.3" supposed quality control plot concattenated out for the whole of last week. Red is the residual ie tidecurve subtration from tide gauge reading and blue is the surge prediction. For some years now a marked disparity.
So a matter of developing BelsizeP tidecurve ,initially adapting the Belsize tidecurve for Soton, then daily tidegauge optimisation.
The green trace in the lower pane is the tops of BelsizeP and the red is the NTSLF tidecurve extracted from the red graphic ,pixel by pixel widget,from the NTSLF realtime tidegauge plots, concattenated to a week.
If the difference at high tides, the green dots, is less than 0.15m make the correction 0.1m, if more then use the difference.
For last week and only 20 May BelsizeP agreeing with the windless quiet-weather and so inverse-barometer only corrected tide gauge readings for 20 May.
BelsizeP 4.90m and 4.86m for the pm tide .
NTSLF Pompey prediction red curve on the realtime tide gauge plots 4.66m and 4.59m.
So in the top plot the high tide points on the red curve displaced downwards mainly 0.1m for the black line and the BelsizeP corrections of 0.24m and 0.27m on 20 May only.
In theory the the black line would then track the blue line, so far so good. In other words , taking the inverse, adding 0.1m 13 to 19 May and adding the 0.24m and 0.27m to the blue NTSLF high tide values if using the NTSLF red tidecurve for the combined tide at Portsmouth .
The NTSLF surge determinations seem to be correct, just the residuals at Pompey, via an out of date tidecurve , need corrections.
Belsize Tide Table
QC comparison check each week in the above section. Any notable departures (assessing against Lymington and NTSLF-Pompey residuals) logged for later curve revisions, two revisions since Nov 2021 with data when quiet weather and deviating more than simple inverse barometer +/- 5cm, this tide table from running the callendar generator on the latest version of the Southampton Belsize tide curve.
One or two high tides dependent
on one or two maxima of the Belsize tide-curve rather than Canute-fashion trying to force the tides into spreadsheet compliance of having always either exactly one or exactly two tides per semi-diurnal tide cycle.
********************************
incorporating EA Woolston quiet weather tide gauge and inverse barometer data from start of 2020 to August 2024, altimetric global sea level rise to August 2024 ,recent anomolous south UK mean sea level rise to August 2024 and local post-glacial isostatic adjustment and 260 harmonic constants.
For all 2025 and the main tide, HW1 or HW2 for each semi-diurnal tide cycle, 2 off 5.2m tides 05+06 December and 10 off 5.1m tides predicted for 2025. For 2026 only 2 in the 5.1m bin and nothing higher.
While at it, the local sea level rise for 2024 from the latest Aviso altimetry 22 year indicial curve fit and Newlyn/NTSLF MSL 5 year anomaly curve-fit.
Global SLR,( accounting for, ie not double-counting the Peltier "global" 0.3mm/year GIA), 4.7mm
UK mean sea level anomaly from Newlyn, 5.5mm
local Hampshire GIA (ground sinking), 1.7mm
Total 11.9mm rise in 2024.
For 2023 ,11.4mm rise
I wonder what the official figures are.
For the latest Belsize tidecurve, 28 May 2025, 3920 datapoints, 264 harmonic constants from 2020.0, RMS error 4.6cm, correlation coefficient 0.9995. The peak of the UK mean sea level anomaly function component of the tidecurve should peak for the year in April 2025.
For all 2026 predictions
ABP has none higher than 4.8m (+0.05m ).
Belsize Soton has 1 for 5.1m and 26 for 5.0m in 2026
Belsize tide table for Southampton, June 2026
Highest tide 5.0m 16 June
NTSLF for Soton, highest 4.47m
ABP , highest 4.6m
day 1
time metres
high 1h37m 4.46
low 5h56m 1.1
high 12h7m 4.36
high 14h20m 4.35
low 18h13m 1.21
day 2
time metres
high 0h25m 4.48
high 1h55m 4.42
low 6h34m 1.09
high 12h49m 4.41
high 15h2m 4.34
low 18h48m 1.26
day 3
time metres
high 1h5m 4.48
low 7h7m 1.19
high 13h30m 4.39
high 16h8m 4.37
low 19h22m 1.38
day 4
time metres
high 1h48m 4.39
high 4h33m 4.19
low 7h39m 1.27
high 15h7m 4.34
high 16h57m 4.27
low 19h59m 1.52
day 5
time metres
high 3h26m 4.33
high 5h19m 4.03
low 8h18m 1.41
high 16h6m 4.35
high 17h35m 4.21
low 20h42m 1.65
day 6
time metres
high 3h11m 4.12
high 4h23m 4.21
low 9h0m 1.57
high 17h0m 4.31
low 21h35m 1.9
day 7
time metres
high 3h50m 4.03
high 5h14m 4.13
low 9h57m 1.83
high 17h55m 4.3
low 22h38m 2.06
day 8
time metres
high 4h40m 4.0
high 6h4m 4.07
low 11h1m 1.95
high 18h57m 4.27
low 23h44m 2.05
day 9
time metres
low 1h53m 2.31
high 6h56m 3.96
low 12h10m 1.94
high 19h57m 4.26
day 10
time metres
low 0h52m 1.95
high 7h56m 3.98
low 13h20m 1.78
high 20h28m 4.32
day 11
time metres
low 1h56m 1.74
high 8h28m 4.14
low 14h19m 1.59
high 21h1m 4.46
day 12
time metres
low 2h49m 1.53
high 9h19m 4.31
high 11h1m 4.24
low 15h13m 1.37
high 21h44m 4.63
high 23h26m 4.58
day 13
time metres
low 3h43m 1.26
high 10h7m 4.58
high 11h53m 4.51
low 16h4m 1.2
high 22h30m 4.79
day 14
time metres
high 0h17m 4.72
low 4h31m 0.98
high 10h53m 4.71
high 12h46m 4.65
low 16h53m 0.97
high 23h17m 4.89
day 15
time metres
high 1h5m 4.82
low 5h19m 0.81
high 11h40m 4.84
high 13h34m 4.75
low 17h39m 0.89
day 16
time metres
high 0h2m 4.96
high 1h50m 4.81
low 6h2m 0.66
high 12h27m 4.85
high 14h26m 4.81
low 18h22m 0.87
day 17
time metres
high 0h50m 4.92
high 2h40m 4.75
low 6h44m 0.67
high 13h13m 4.9
high 15h17m 4.85
low 19h5m 0.94
day 18
time metres
high 1h35m 4.88
low 7h23m 0.73
high 14h5m 4.74
high 16h6m 4.78
low 19h44m 1.08
day 19
time metres
high 2h36m 4.72
low 8h8m 0.93
high 16h52m 4.76
low 20h34m 1.31
day 20
time metres
high 3h46m 4.56
low 8h56m 1.14
high 17h44m 4.64
low 21h26m 1.61
day 21
time metres
high 4h46m 4.4
low 9h55m 1.48
high 17h34m 4.51
low 22h29m 1.8
day 22
time metres
high 5h40m 4.21
low 11h1m 1.69
high 18h41m 4.39
low 23h35m 1.9
day 23
time metres
low 1h23m 2.21
high 6h50m 4.07
low 12h8m 1.75
high 19h35m 4.31
day 24
time metres
low 0h42m 1.9
high 7h58m 4.02
low 13h9m 1.72
high 20h26m 4.33
day 25
time metres
low 1h46m 1.8
high 8h52m 4.07
low 14h10m 1.7
high 21h19m 4.31
day 26
time metres
low 2h41m 1.68
high 9h43m 4.09
low 15h3m 1.64
high 22h10m 4.29
high 23h17m 4.27
day 27
time metres
low 3h34m 1.63
high 10h39m 4.13
high 11h29m 4.13
low 15h51m 1.62
high 23h1m 4.32
day 28
time metres
low 4h17m 1.51
high 11h1m 4.17
high 12h10m 4.18
low 16h31m 1.56
high 23h34m 4.39
day 29
time metres
low 4h57m 1.45
high 11h46m 4.33
high 12h42m 4.33
low 17h10m 1.52
high 23h49m 4.47
day 30
time metres
low 5h32m 1.28
high 12h2m 4.36
low 17h45m 1.37
high 20h26m 2.82
low 20h53m 2.81
Taking the definition of
The height of Mean High Water Springs ( MHWS ) is the average throughout the year, of two successive high waters, during a 24-hour period in each month when the range of the tide is at its greatest (Spring tides). and neaps and low waters as well.
Comparing Belsize Soton for 2024 and ABP 24 datapoints each time.
MHWS 0.14m Belsize higher than ABP
MHWN 0.19m ""
MLWS 0.00m no difference
MLWN 0.03m Belsize higher than ABP
So it looks like Belsize 2024 tide table is about right.
The other considerations are
1/ To continue using Lymington to compare with Belsize over 4-5 years requires subtracting 0.15m from their processed residuals outputs.
2/ Newlyn mean sea level offset for 2024 about 0.18m .
3/ EA internal tidecurve for Soton needs 0.1m adding to their Soton tide heights
VTS under-reporting rolling , 3-day averages, daily 7.8, 7.8, 8.1, 9.5, 9.6, 9.2, 9.5, 9.6, 10.4, 11.0, 11.8, 11.7, 11.6, 11.2, 11.9 , 13.8, 14.3, 14.1, 13.4, 13.3, 13.6, 13.2, 12.9, 12.9, 11.7, 11.7, 12.9, ?, 10.7, 7.5, 3.9, 3, 3.7 , 3.5, 3.1, 3.3, 3.4 cm latest on 29 Dec 2020.
VTS under-reporting rolling , 3-day averages, daily ... 5.7, 5.0, 4.6, 3.8, 3.4, 3.2 , 3.2, 1.7, 1.9, 2.1, 3.6, 3.5, 4.2 , 4.1, 3.5, 2.5 , 2.8, 3.0, 3.4, 2.9, 1.8, 1.2, 1.3, 1.3, 1.4, 0.9, 0.9, 0.8, 0.3, 0.2, -1.0, -1.3, -2.3, -3.5cm (ie over-reporting) last on 29 Mar
VTS under-reporting rolling , 3-day averages, daily ... 5.7, 5.0, 4.6, 3.8, 3.4, 3.2 , 3.2, 1.7, 1.9, 2.1, 3.6, 3.5, 4.2 , 4.1, 3.5, 2.5 , 2.8, 3.0, 3.4, 2.9, 1.8, 1.2, 1.3, 1.3, 1.4, 0.9, 0.9, 0.8, 0.3, 0.2, -1.0 (over-reporting), -1.3, -2.3, -3.5, -2.7, -4.2, -3.2, -3.3, -3.0, -3.8, -4.0, -2.5, -1.8, -1.2, -2.5, -2.6, -2.5 , -2.5, -0.6, +1.2, +2.4, +1.9cm last on 16 Apr 2021
On-the-ground mark1 eyeball "calibration" check of Woolston gauge against Priory Rd Hard vernier gauge (itself cross-calibrated against a nearby OS bracket benchmark on the church
and the OS probably world's worst barely visible cut mark on Cobden Bridge concrete pillar), for the same high tide times, despite 2.5 miles separation, at slack water. Surprisingly consistent, considering the timing delay,1/4hour spacing readings, change in air pressure /gradient, wind direction and strength variation, salinity/density variation, small scale local gyres/currents and different spring/neap tide cycle etc.
28 Mar 2024 12:30 5.26m , Woolston 5.28m
12 Mar 2024 12:00, 5.27m, Woolston 5.21m
08 Feb 2024 10:00, 4.86m, Woolston 4.84m
30 Sep 2023 12:15, 5.05m, Woolston 5.04m
20 Sep 2023, 14:45, 4.73m, Woolston 4.67m
02 Aug 2023 12:00, 5.14, Woolston 5.08m
10 Mar 2023 00:15, 5.31, Woolston 5.27m
22 Feb 2023 12:15, 5.00m, Woolston 4.98m
21 Feb 2023 11:30, 4.97m, Woolston 4.93m
22 Dec 2022 09:45, 4.98m , Woolston 5.01m
11 Sep 2022 12:15, 4.84m, Woolston 4.81m
06 Feb 2022 14:15, 4.94m, Woolston 4.91m
03 Feb 2022 12:15 4.91m, Woolston 4.87m
02 Jan 2022 10:15 5.06m, Woolston 5.04m
21 Nov 2021 11:30 4.57m, Woolston 4.51m
04 Nov 10:00 GMT 4.87m, Woolston 4.86m
08 Oct 12:45 BST, 4.88m, Woolston 4.85m
09 Sep 13:15 4.92, Woolston 4.88m
24 Aug 13:00 4.51m, Woolston 4.42m (difference 9cm, peak tide would have been about 10 minutes earlier)
08 August noon BST 4.56m, Woolston 4.52m
14 July 2021 14:45 BST 4.36, Woolston 4.31m
26 June 12:45 BST 4.71m, Woolston 4.68m
24 June 2021 11:00BST 4.62m, Woolston 4.58m
28 Apr 2021 PRH 5.03m at 12:15, Woolston 5.02m
28 Apr PRH 5.05m at 12:30 , Woolston 4.99m
27 Apr 2021 4.90 at 11:45, Woolston 4.88m
13 Apr 4.44m at 12:45, Woolston 4.40m
01 Apr at 14:15 4.80m, Woolston 4.76m
31 Mar at 12:30 4.88, Woolston 4.86m
01 Mar at 12:00 GMT 4.71m , Woolston 4.70m
30 Jan 2021 at 11:45 GMT 5.03m, Woolstom 5.01m
31 Dec 2020 at 11:30 4.61m, Woolston 4.58m
13 Dec at 09:15 4.97, Woolston 4.94m
17 Nov at 11:30 5.00m, Woolston 4.98m
14 Nov 2020 at 09:30 5.18m, Woolston 5.16m
13 Nov at 08:45 4.84m, Woolston 4.81m
02 Nov at 11:45 GMT 4.62m, Woolston 4.61m
21 Oct at 14:30 4.74m, Woolston 4.69m
16 Oct at 11:45 4.97, Woolston 4.91m
04 Oct at 13:00 4.88m , Woolston 4.85m
02 Oct 2020 12:00 4.71m, Woolston 4.69m
So the Itchen at the hard is 1 to 9 cm, average about 3cm, higher than Woolston for the same times at high tide slack water.
Locally higher than Woolston , maybe from this effect.
19 June 2021 10:40 to 10:50 BST , from the wind effect on the water I thought the tide was going out but the waterline was going up in those 10 minutes relative to stuff in the mud. I always thought tides were from a head of water migrating from where the level was high to where it was low. But looking in the Woolston record it was still ebbing to low tide there then. So the sun and moon gravity relative to the Earth was pulling "our" part of the Itchen upward ,about 1/4 hour before Woolston level started to rise.
Supplementary Cross-"calibration" check, 29 March 2021
Comparing EA Soton Water side 9263 Eling gauge to Woolston 1034 over the last 10 tides,ignoring times of peaks, Woolston lower than Eling by 2 (4.2m tide) to 9 cm (4.7m tide) , average 5cm .
Priory Rd Hard peak at 11:15 GMT today was 4.74m steady , not obviously rising or falling, no technology required other than a watch.
Woolston gauge at 11:15 GMT 4.71m
From Eling peak reading -5cm , second-guessing Woolston comes to 4.72m , so Woolston gauge reading , balance of probability, is reliable compared to VTS.
As continuing problems with Admiralty/ABP/UKHO tide-table predictions for Soton , my own derivation from local tide-gauge readings Jan to current date of a tide-curve.
NOT TO BE USED for safety critical purposes, just for comparison with other sources and the reality of local tide gauges.
Belsize tide-tables , with latest Belsize tide-curve and UKHO HW time&height comparisons to normalised VTS (middle group of each 3 records, , checked against local visual vernier tide gauge and Woolston EA gauge). UKHO historic tide evaluations are not based on the tide-curve as used in 1986 for Soton ABP blue-book, back to a time when those printed tide times agreed with reality far better than these days.
eg Basically about 20 to 30 minutes out for HWs the 04/05 April 1986 and a few minutes for LWs I've looked at so far, so cannot be GMT/BST confusion. Blue-books of the time had GMT throughout, as I add to write "add 1 hour" at the top of all the summer pages.
Interesting change of levels data on page 5, so Cd/OSD conversion was still 2.74 and later uncoupling of CD from LAT.
An interim empirical predictor for single HWs maybe (as only from examples on Mar 2020 , 05 ,16 and 17 and Apr 01,02 ,03, 29 and May02 , but not 12 May) for the next high tide/s.
Using the previous tides recorded by VTS and normalised .
IF
previous high tides were doubles and height of 2HW-1HW is greater than -0.01m
AND
the previous LW was greater than 1.2m and less than 1.7m
THEN
next tide is likely be a single HW
If previous high tide was single and next LW was higher than 1.8m
THEN
next tide is likely to be single or double HW but very biased to one side.
For marine flooding purposes we need to know in advance ,the maximum height or heights and times, height more important than timing) over the high water period rather than the Admiralty/ABP apparent selction of values indicating the period of water level ,with undisclosed actual high-water levels, above pairs of heights, so never single high water data, for port operations reasons presumably, rather than the times and heights of high-water peaks.
So for single high-water situations, the actual maximum height/s will be higher than the values ABP/UKHO describe as "high water ", it cannot at the same time be times and heights of double high tides and undefined "shoulders" of single tides. What criterion they use for defining such "high water" periods is still unknown. Maybe it all harks back to the lost-in-history original local use of the term High Water rather than High Tide.
Most recent Belsize tide-table for Soton with some QC comparisons with UKHO in the last few days, where high means highest level and low means lowest level , any YFS datapoints I've left in , just for interest. The ideal covid lockdown persuit, very time consuming, consolidating each new day of data with 2 parameters per harmonic constant and wildcard finding new harmonics , to bring the RMS error factor ever lessening. Apparently NOC Poltips , used by NTSLF/EA, uses up to 240 harmonic constants plus shallow water corrections.
Running the Belsize tide-curve calendar generator for 2022 , like the ABP 2022 Blue Book, highest tides 4.8m.
I get the dates of 4.8m tides as
04 Jan 2022
17 May
11,12,13 Sep
24 Nov
22,23,24 Dec 2022
Looks like I have to wait for EA warning texts to compare Belsize
Soton tide predictions with the big-boys of EA/Poltips or whatever
they use, rather than comparing with the rubbish UKHO/ Easytide
predictions. Quoting only one height and two times seems to be their
way round the double/single tide conundrum, with no publically
disclosed plotted curves to create contradictions.
1HW 9h52m 4.92 ( Belsize )
09:44 on 14/11/20 , 5.24 - 0.28 = 4.96 ( EA )
2HW 11h22m (Belsize)
11:46 on 15/11/2020 (EA)
1HW 22h5m 4.84 ( Belsize)
22:02 on 14/11/2020 , 5.14- 0.33= 4.81 (EA)
2HW 23h50m ( Belsize)
00:10 on 15/11/2020 (EA)
1HW 10h25m 4.91 ( Belsize )
10:26 on 15/11/2020 , 5.29 - 0.31 = 4.98 ( EA)
2HW 12:35 ( Belsize)
12:35 on 15/11/2020 ( EA )
1HW 22h44m 4.89 ( Belsize )
22:46 on 15/11/2020 , 5.22 - 0.32 = 4.90 ( EA)
2HW 0h39m ( Belsize)
01:00 on 16/11/2020 ( EA )
Average of 4 height differences = 3.75cm
Average of 8 timing differences = 10 minutes
Going by memory this is like the 1980s ABP blue-book tide predictions against reality for quiet weather situations, generally accurate to about 5cm and 5 minutes
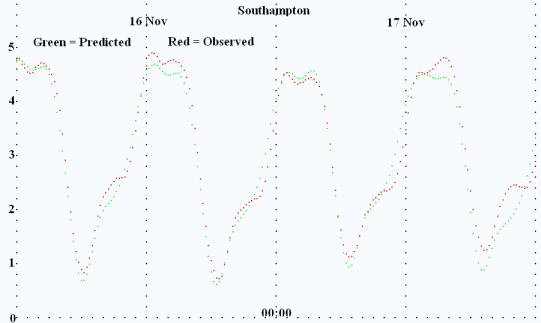
A rare beast, Belsize prediction with observed tide (Woolston EA 1034 tide-gauge "CSV" )
for relatively quiet meteorologically , spring tides of 16 and 17 Nov 2020.
Plotting out for 22 and 23 Nov showed the single neap tides of then.
Developing the Belsize tide-curve ,for anyone else to do similar, I highly recommend this curve-fitter, best use of javascript I've seen. Started as a covid lockdown project, retrieving data from the archives back to 01 Jan 2020 and updating daily.
statpages.info/nonlin.html
Saving the source file to disc and running off-line works fine, just the loss of the compact +/- symbol. Pushed well past the limits quoted on that page and run iterations thousands of times without crashing or introducing errors. I never developed an XL manipulation , just copy cut and paste and some of my own failings there, misreading c as e, unintended and unobserved, as not used by me, drag and drop, etc.
Obtain a full set of basic astronomic tidal harmonic constants such as the NASA/NOAA dataset, usually in terms of degrees/hour, so need converting to radians per hour.
For the tide curve equation, I used a summation of Sines form with leads , rather than Cosines with lags, for my own convenience. For instance initial construction using using zero-sum form , from first differential of the curve, is easier starting from sines, and generally no requirement to copy and paste the accompanying signs with any parameter value , as always positive. Tide gauge readings with a way of determining a reasonable value for local residual to add/subtract from the readings.
Convert the times to the (year day number)*24 plus decimal minutes, accounting for BST/GMT, leap-years. Iteration times getting longer and longer until one iteration with about 200 sine terms, ie 200 terms containing x and 8 parameters taking about 7 seconds on a notebook pc.
Add in a wildcard of a+b*sin(c*x+d) stepping thru speeds of c from 0.007 to 4 in radian terms. If you find a minimum RMS, try .5* ,2*, .3333* ,3* etc of that c value.
Then a matter of finding integral number multiples or sum and difference combinations of those basic HCs to closest match the best ,ie least RMS error value of c.
Arrange all the HCs in order of speeds, so its possible to try optimising on a small subset if the errors to the curve are a group of diurnal or semi-diurnal tides or sixth diurnal if substantially affecting only 1HW or 2HW. I sometimes ran optimisation on combined amplitudes and phases per term and other times staggering of phase parameters of every 4 terms, every 8, and every 16 but i don't think it made any difference to the speed of converging to overall minimum RMS error.
When optimising , choose the phases, staggered each other one as some HCs are close pairs and the curve-fitter starts "oscillating" around a value but not converging, if too close in frequency. Keep all parameters positive, eases ctrl-C/ctrl-V
, by adding/subtracting 2*3.1416 for phases or changing amplitude from - and adding 3.1416 to the phase term, to keep the phase angle between 0 and 9.999. If a good drop in RMS error for one batch of phases ,optimise the corresponding amplitudes before going to next block of phases.
Concentrate on the HCs with >5 mm amplitude.
To keep regular amplitude and phase pairs, ignore the mean sea level "DC" component most of the time , just returning to it as a single parameter every now and then.
Every now and then go thru all the amplitudes. Just because an amplitude is sub-mm , repeated every day for a year of datapoints can amount to quite a reduction in overall RMS Error.
If all the errors in a day/few days of data are unipolar, ie all + or all -, then optimise the low frequncy end of the function.
If you've made no error and the result is converging to too high an RMS error value, try changing gear in the "adjustment factor" and change back up again when it has passed through the bottle-neck, probably due to the cyclic rather than linear progression of sines or cosines, especially with sub-mm amplitudes varying sign on each iteration .
Sometimes zero in on the highest amplitude ones. Don't scrub sub-mm amplitude terms as they sometimes rise again weeks later.
Each day of data , check for transcription errors by changing the data set but using the last run of the day before and iterating once, and check the individual errors and average of the sum of absolute errors of the new data before changing the parameter set.
9 months in I decided the predictions for spring tides were much better than neaps. Assuming an error in the Lymington residual I was using, from their underlying curve that did not account for meteorological effects, apparently using random updates rather than when meteorologically quiet. I decided such error would have more effect at neaps than springs and i might be chasing my own tail. So decided to revise the tidegauge readings each time by taking the average of residual from Lymington and the residual from the Belsize curve at the tide-gauge time points. Hopefully a few months in and an improvement in neaps/single/double tide predictions I could move to 1/3 to 2/3 or 3/4 to 1/4 scaling or whatever, rather than average. Log which harmonics maximally control areas of the tide-curve. eg controlling single or double tides harmonics around 1.5353 radians/hour . Or pulling-in the height difference between predicted and observed around 2 hours before 1HW ,but probably any repeated part of the curve, involving mainly harmonics speeds of 0.0177 (2week cycle), 0.51, 0.52, 0.75, 1.03, 1.517 and 1.564 rads/hr (notice the multipliers of 2 and 3 occuring, the 3 multiplier related to a square/pulse wave of exagerated mark-space ratio, expressed as a sum of odd harmonics and reducing amplitudes, super-imposed on the fundamental tide curve). 5th and 7th harmonics showed up in the wild-card process but not enough effect on the RMS Error to bother including in the tide-curve formula.
For a single point like the double low 20 to 21 Jan 2020 , create a simple widget to itemise the indivdual amplitude and phase component value , printed out tabular , then just concentrate on all the ones greater than 1cm , 8 phases then the corresponding 8 amplitudes. For a pair of such points , repeated daily say, do similar printing out the pairs and go with similar contribution harmonics.
After passing thru all such components perhaps twice, make a widget to compare each of the old and recent amps and phases and determine the absolute difference in amplitude and phase and concentrate on those. Repeat similar but adding 2*Pi to the phases if the phase is less than Pi , differencing , and concentrate on the ones woth a difference around Pi.
With slower and slower convergence - another technique.
Using the wildcard process to find a marginal RMS error reducing HC.
Start with the set of HCs contributing to >1cm of tide height at the time of interest and assume that 1 or more new HCs would be close to 1 or more of those HCs to affect only over a few days only time span , dropping out after that and entering ,in turn, each of those HC speeds in the reduced ,3 not 4, wildcard factor.
Place the wildcard factor at the start of the formula box with the angular speed replacing the parameter , so only 3 parameters a constant, amplitude and phase. Manually change the last digits , optimise and gradually zero in on the target HC speed.
eg one got to 2.5224 rads/hour about nidway between 2 existing HCs, so close to 3519* Sa , so the new HC was 9*17*23*Sa .
Still not converging , bringing in the diplaced YFS datapoints. Determine the worst RMS errors and force the y of each datapoint by its RMS error, sign is the sign of the error, so the overall RMS error increases each time. Hopefully leverages the forcing at the "worst" errors. Every now and then nullify the y forcings and check the RMS error with the proper dataset is not diverging and the YFS errors are actually decreasing. At the same time reign in the forcings to match each new individual RMS error.
Another chance to compare before and after HCs and zero-in on the ones with most change of amplitude and phase.
Tried one of the forcings tobe 1m and improved the convergence to about 3mm per 8 parameter round of optimisation. No deformation of the tide-curve in the future a few weeks later than that datapoint, but whether 10m forcing would cause problems, unknown as yet.
Remove the 1m forcings and the the errors at the critical points relieve themselves, ie increasing the errors, by about 0.5mm per 8 parameter round of optimisation. Still undecided whether to retain the forcings until much lower errors , but locally distorting the tide curve or some intermediate forcings but only level-pegging on the errors of most significance, to overall consolidate the curve.
Reviewing all the individual RMS errors in the results file , for the worst case. Check for a silly error and then whether this error has grown from not showing up initially. The optimisation process may have been sidling HCs to overall bring down the overall RMS error and there is a problem with the residual of that datapoint and the optimistaion is highlighting there is a problem at that point, that cannot be absorbed by shuffling the HCs.
A number of YFS points were well separated from the tide gauge record, the worst one was adrift by about 0.85m. Analysing the tide curve for that timepoint, for all constituent HC , ie amplitude and phase at that time gave about 50 HCs with a costituent more than 1cm in height. Forcing that datapoint in the datafile by 10m brought the RMS Error down to about 0.35m in one pass of amp and phase of those 50 HCs , 8 at a time. The overall RMS error, wiht the 10m point raised to over 0.22 sq m and removing the 10m after the forcing had increased the overall RMS Error from 0.043 to 0.058 , so returned to normal optimisation of only the sub 1cm HCs , to avoid udoing some of that 0.5m of gain .
Also a still retained seriously sub-millimetre HC amplitude of 0.00007 (awkward for convergence, ie oscillating ) jumped up to 0.011 . Then the mai HCs, ignoring sets that although reducing overall RMS error increased the worst YFS error .
"balloon poodle" effect
Squash one bit of the balloon and it splurges out somewhere else.
If forcing produced the desired localised reduction of RMS error, but then reverting to normal without forcing, it bulges out substantially.
Perhaps the tide-curve is telling you that your datapoint/s are out and require more anti-residual correction to the tide-gauge readings than first thought.
Still trying to pull in these YFS points. Using the analysis of all the contributions of all the HCs at the time of the worst point. Add 1*a to all the +ve HC amplitudes amd -1*a for the negative ones for amplitudes >5cm. And same with 1*b for >1cm <5cm. 13 HCs with "a" and 32 with "b"
Then use the curve-fit as a calculator with the minimum convergence "rate" of 0.05 try different values of a and b. When a reasonable pair, increased overall RMS error and much reduced error at that YFS point, return to normal optimising but only on the remaining HCs , clearly designated by not having the +/-1* signatures in the amplitudes.
The point error continued reducing , so I could every now and then knock back one or both of those block of a or b offsets, reducing the overall RMS error .
Gave up trying to reign-in the YFS and decided to start again the next time it occurs or another major deviation.
Analyse the worst "offender" on all amplitudes and phase contributions to that spot height. Retain all the amps and phases for all the sub-cm contributors , set all the >1cm amps and their phases to zero except 2*4 of the largest contributors . Optimise those 2X4 and then all the remaining reset to zero HCs, 8 at a time.
If the RMS error on only the 6 daily updates has been lower for days , compared to the overall optimised RMS error,ie RMS error is reducing slightly each day just because of that fact, find the worst datapoint x value "offender".
Analyse that one for its main contributors, say > 1cm, and optimise on that small subset of HCs amps and phases, should bring that spot in closer and all the other ones related to it in the same part of the tide cycle, over the months.
Beware when values of x are large , for historic or far future dates ,any minus sign or the most significant digits get truncated in the returned data listing, its not a bug or argument limitation in the javascript processing, just fixed frame and positioning for the presentation.
Tidal Miscellanea
See my earlier graff.htm "Southampton Graffiti " file wherever it may be these days, archive.org pehaps, has some local flooding info , not carried over to these " solent" files
Cowes Harbour OSD/Cd conversion
With the return of the CHC www tide-gauge in May 2021 . First of all comparing the EA 1020 gauge with the CHC gauge in a quiet weather period over a number of tide cycles, the 2 outputs match with decades old OSD/Cd conversion of 2.59m added to the EA output.
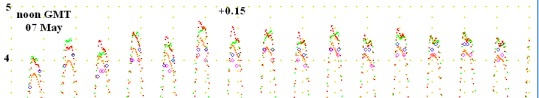
Thumbnail image version , Green = Belsize, Red = EA 1034 Woolston, blue diamonds are UKHO Soton, orange is EA 1020 Cowes gauge (with 2.59m OSD/Cd conversion) and purple diamonds are the UKHO Cowes predictions (minus 07 May).
But from optical surveying to 2 surviving benchmarks in Cowes High St, I make the connversion factor more like 2.77m.
So I adapted my 3 way comparison plot widget to compare Belsize, EA 1034 Woolston, UKHO Soton predictions, Cowes 1020 and UKHO Cowes predictions for weather quiet period 07 to 14 May 2014 (just one +0.15m residual overlain). Unfortunately as much vagueness with UKHO Cowes predictions compared to reality as the Soton UKHO figures. Summing and averaging the difference between UKHO Cowes and Soton high tide heights came to 0.14m , Soton higher, presumably the accepted Correolis north-south difference between the two ports.
Summing and averaging the difference between Cowes and Woolston gauge high tide heights came to a much more consistent 0.32m. So 0.32m - 0.14m = 0.18m , surprisingly, the same difference between 2.77m and 2.59m . It still leaves a 0.14m Correolis height difference between the tides at Soton and Cowes, more realistic than 0.32m ? (requires more expert knowledge as its a bounded sea area, shallow water etc). It also removes the conundrum of why only the peaks of over-topping waves came over Cowes Quay wall on 14 Feb 2014 and not fully flooding over the wall. At least using Soton and Cowes gauges removes the weather induced residuals variability.
Just a fluke ,the 18cm difference. Repeated the exercise the next week 14 to 21 May , tide gauge readings more consistent, UKHO diff= 0.21m,EA gauge diff= 0.29m ,
OSD/Cd difference = 8cm, conversion factor= 2.67m so requiring a long run of such checks .
None of this explains why both CHC and EA agree despite decades of sea level rise, either Cd level relative to OSD has to change or quoted sea heights must be higher or a bit of both.
Repeating for 21 to 28 May 2021, tide gauge readings more consistent
Differences UKHO,EA, OSD/Cd
0.24m, 0.36m, 12cm
Repeating for 21 to 28 May 2021, tide gauge readings again more consistent than predictions comparisons.
Differences UKHO,EA, OSD/Cd conversion
0.24m, 0.36m, 12cm
Average OSD/Cd conversion for Cowes, over 3 weeks 18,8 and 12cm added to 2.59m = 2.72m
Continuing the average OSD/Cd conversion for Cowes, from EA gauges and UKHO prediction differences over 7 weeks 07 May to 25 June 2021 of all high tides 18, 8 , 12, 14, 16, 13, 15cm = 13.7cm added to 2.59m = 2.73m much the same as the Southampton OSD/CD conversion, just the Cd height difference between Cowes and Soton representing the Correolis difference.
Cowes tide heights referenced to OS bench-marks in Cowes.
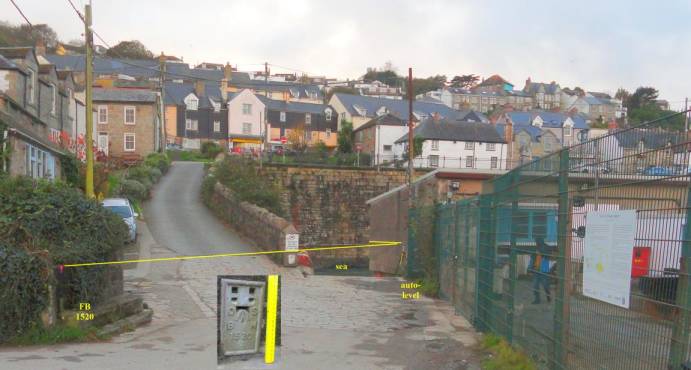
27 May 2021 ,before the bank-holiday and then summer tourist influxes and on a spring tide I took my Japanese optical-surveying auto-level over to Cowes and Yarmouth.
Unfortunately in Cowes a lage van parked in front of the Vectis Tavern so more complex/less accurate survey legs around it. Also a very large SWA sewage pump and fencing in the Sun Hill slip area , so having to assume sea-wall on the south side of the slip is the same height as the wall top under the SWA building, with the EA tide gauge, to the north of the slip.
Top of sea-wall at Sun hill slip 2.57m OSD
Top of sea-wall at Town Quay near the old crane 2.73m .
My new portable stilling well and tide-gauge idea worked very well (a clear plastic tube weighted at the bottom and sealed except for a few small ingress holes, 1.5m long glass-fibre reinforced seemstress tape-measure secured to the bottom and some small expanded polystyrene beads and coloured cistern block for dying/contrast laid in the bottom to assist viewing the height difference to the wall top, when the level had staqbilised ) .
For a 4.20m (using 2.59m conversion) tide , 1.61m OSD, 0.91m below at Sun Hill slip and 1.19m below the town quay sea-wall.
Sun Hill slip gave 1.55m OSD tide height and 1.54m at the Town Quay crane sea-wall.
So an OSD/Cd conversion factor more like 2.64 or 2.65 from bench-marks, again higher than 2.59m, but 8cm less than from Soton/Cowes tide-gauge and UKHO prediction comparison.
The ground level at the lowest drain near the finger-board, surveys to 2.22m OSD so agrees with my 2018 higher spring tide water level readings in the drain.
Pavement level 2.26m OSD at the Fountain Inn opposite the Vectic Tavern
For Yarmouth the accepted conversion is 1.98m.
Using the 10 Mar 2008 flood mark of the 3.0m tide +1.1m surge at that flooding and sea level rise info board. 3-leg surveying along Bridge Rd and St James St to the OS flush bracket 3.88m OSD at the church door, gave a conversion factor of 1.97m, so no quibble there. Of course used sighting scales tied to the lamp posts but for anyone else doing this, may be useful. Ground level at the info board 1.53m OSD.
Ground level of lamppost at W end of Bridge Rd next to the ferry loading park 1.94m OSD, lamppost St James St on the church side of the road and E end of Bridge Rd 3.10 OSD.
VTS graphic pixel-counting evaluation of over-reading average of 10cm, from 2 rounding transition points, 1 going up and 1 down, on last nights high tide. Amother reason www VTS does not have a tide-curve for prediction, the green form and timing of YFS is always spot on, unlike UKHO and Belsize.
Local Sea Level rise
I've now included global sea level rise and the local post-glacial geological isostatic rebound, into the Belsize tide curve. From 1985 to 2020 about 11cm global sea level rise and about 6cm from the 1.7mm/year south Hampshire sinking of the land, giving about 17cm in total.
So is sea level rise evident in the local tide record ?
From 1985 ABP Blue book , when the predictions were highly reliable and provided by the Birkenhead Institue of Oceanographic Sciences.
The low tide and highest high tide in each tide cycle for 1985 and from my datafile for 2020 VTS and then Woolston tide gauge record with Lymington residuals subtracted. Majority of the tides in 2020 that is, sometimes there was gauge failures, 704 pairs in 1985 and 658 pairs from 2020.
Frequency distribution of instances in each height bin for the high tides of each pair.
high tide ht , 1985, 2020
3.4m, 1, 0
3.5, 22, 0
3.6, 41, 10
3.7, 40, 27
3.8, 64, 32
3.9, 59, 45
4.0, 57, 51
4.1, 77, 52
4.2, 86, 74
4.3, 102, 85
4.4, 62, 97
4.5, 38, 69
4.6, 31, 44
4.7, 16, 33
4.8, 8, 20
4.9, 0, 11
5.0, 0, 8
So lowest high tides jumping 2 bins and also 2 bins higher for the highest high tides and the modal group moving up 1 bin from 4.3m to 4.4m.
The simple mean height for 1985 was 4.11m and for 2020 was 4.27m, so an increase of 16cm.
For the low tides comparison
height (m) bin , 1985, 2020
0.0 , 5 , 0
0.1 , 11 , 5
0.2 , 18 , 6
0.3 , 24 , 19
0.4 , 19 , 16
0.5 , 38 , 19
0.6 , 52 , 19
0.7 , 60 , 18
0.8 , 52 , 36
0.9 , 49 , 49
1.0 , 49 , 53
1.1 , 35 , 48
1.2 , 32 , 43
1.3 , 44 , 36
1.4 , 34 , 36
1.5 , 36 , 29
1.6 , 31 , 40
1.7 , 45 , 33
1.8 , 26 , 29
1.9 , 22 , 39
2.0 , 9 , 31
2.1 , 7 , 31
2.2 , 2 , 16
2.3 , 0 , 5
2.4 , 0 , 2
lowest low up 1 bin
highest low up 2 bins
modal group up 3 bins from 0.7 to 1.0
note the 1985 frequency anomaly in 1.7m bin transfers to 1.9m bin in 2020
and 1.3m to 1.6m also, presumably some characteristic of the Soton tide curve.
1985 simple mean = 1.05m
2020 simple mean = 1.28m
difference = 23cm
Average of highs and lows = 0.5*( 16+23) =19.5 cm
Rise by global sea level rise and GIA = 17cm
Average of two completely different processes= 0.5*(17+19.5)= 18cm over 35 years.
Ignore the ABP blue book reference to Mean Tide level = 2.63m , it was 2.62m in 1985 and 1987 books and 2.63m in 2010,so not updated, just copy and pasting each year.
Same for MHWS,MHWN,MLWS,MLWN just VTS obfuscation like the recent downgrading of public www VTS tide-gauge outputs to 1 decimal place .
No change in those 4 means , just quoting the same figures 35 years later but rounded to 1 decimal place rather than the 1980s 2 decimal places.
Bores in Southampton Water ?
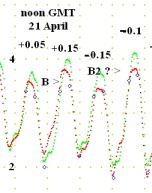
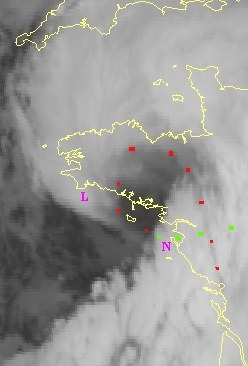
No Mk1 eyeball sightings by anyone on 21 Apr , my interpretation of very fast rises just before 1HW. As the neapest of neaps, with double low tides rather than spring tides, may well not have been a step surge was involved. In that image the main on marked B and a lesser one the next diurnal tide , 22 April. Initially I thought is was some mistake on my part creating the 3way comparison, Green= Belsize, Red= Woolston, Blue diamonds= tabulated UKHO.
It looks as though these fast rise times knocked out VTS , both days.
To avoid jitter in bubbler outputs , the supply pipe air pressure is kept as low as possible. Set at the highest normal tide rise plus a bit, but not enough to cater for fast rise surges and these bores.
Fast rise time, bubbles cease, "protective" cut-out of the bubbler control until a manual reset.
Seems a bit too big for the result of a ship movement, no such cause seen on ABP ships movements for those times..
Not obviously caught on Lymington, Cowes, Pompey or even Hamble tide gauges.
The graphical Woolston and Eling plots its not too obvious , but the vertical or near enough vertical bits of the plots.
So a drop from the expected tide level and then a large increase, over half and hour or so.
Woolston
2021-04-21T17:15Z 0.968
2021-04-21T17:00Z 0.921
2021-04-21T16:45Z 0.727
2021-04-21T16:30Z 0.713
2021-04-21T16:15Z 0.596
Eling
2021-04-21T17:15Z 1.024
2021-04-21T17:00Z 0.943
2021-04-21T16:45Z 0.93
2021-04-21T16:30Z 0.714
2021-04-21T16:15Z 0.646
Unlikely a glitch in EA national processing as different timing and only 2 of their gauges showing this. Unlikely a bore as a springs phenomenon I thought. Something to do with the double lows/YFS conjunction?
22 Apr 2021
Clumping together of pairs of datapoints (a and b) on the Woolston record and a fall (c) on the Eling record.
Similar "double" low neaps period next month on 05,06,21 May, to see if this "bore" characteristic repeats
Woolston
2021-04-22T19:30Z 1.049
2021-04-22T19:15Z 1.015 b
2021-04-22T19:00Z 1.016 b
2021-04-22T18:45Z 0.932 a
2021-04-22T18:30Z 0.918 a
2021-04-22T18:15Z 0.812
Eling
2021-04-22T20:00Z 1.108
2021-04-22T19:45Z 1.094
2021-04-22T19:30Z 1.072
2021-04-22T19:15Z 1.085 c
2021-04-22T19:00Z 1.091
2021-04-22T18:45Z 1.037
2021-04-22T18:30Z 0.961
2021-04-22T18:15Z 0.869
In the end , no bores seen at any time
3 way comparison for the lowest tides of the year. Coinciding with the grounding of the "Ever Given" in the Suez Canal. Did they try passing the ship thru on too low a tide , combined with difficulty in predicting the tides at that time.
no storminess in that week so the remaining corrections , for the higher tides, much the same , basically just the inverse barometer.
So yet again , when there is a marked disparity between Belsize and UKHO, reality is about the average, as far as the heights of tides are concerned. 0.7m divergence maximum between Belsize and UKHO predictions, luckily reality was between the two. Perhaps someone in Egypt had an over-prediction like the Belsize one and maybe sandstorms are associated with high pressure, no low pressure around Suez 23 March 2021, further reducing tide level. Other features of this unusual tide period, double low waters for Soton , lowest tides of the year and quick turnaroud from a minimum tidal range of 1.3m to 3.3m in just 3 days. When will a similar grounding occur, involving bad tide preditiom as a contributory factor i Southampton Water or the Marchwood swinging grounds, on a descending ebb tide ? .
Double low tides.
From the Belsize tide-curve, I was half expecting from Belsize double low tide of later 21 Jan prediction, for double tides to appear a day or two either side of that, actually around midnight 20 to 21 Jan 2021 but nothing as dramatic as last night.
Included is a thumbnail comparison of the recent lows, red line is 2.74m future Woolston empty set .
Affected the IoW area only , Christchurch and Lymington having triple lows, doubles on Ryde,Cowes,Bembridge and Pompey gauges but nothing farther afield as Weymouth or Shoreham or Newhaven. Most dramatic for Soton with 0.5m rise between lows. I wonder if it was something to do with the more general 0.5m residual of extra wind driven water around. Worthy of a few more datapoints to hopefully tighten up the Belsize tide-curve .
No trace of double lows on the big-boy prediction tide-curves used for Lymington, UKHO or NTSLF www presentations.
It looks like double lows, so far, have a return period of either 5 or 6 lunar months going by the previous lesser examples on 05 Mar 2020 and 28 Aug 2020
For when NTSLF tide gauge reporting system craps out again and have to use the Environment Gauges, now (late 2020) they are reporting much closer to real time.
Port, UKHO port code number, nearest EA gauge number, Cd-OSD conversion in metres
Newlyn, 0002, 3156, 3.05m
Falmouth/Truro, 0005, 3162, (OSD/Cd approximately as circuitously via average of a few quiet weather NTSLF residuals for HT at Newlyn and Plymouth compared to UKHO Falmouth predicted heights and EA tide-gauge heights = 2.62m, as not found on the www anywhere )
Plymouth/Devonport, 0014, 3344, 3.22m
Weymouth/Portland, 0033, 3353, 0.93m
West Bay (Channel Observatory chart= 83, no longer tide-gauge info)
Christchurch 0038 , 3332 (OSD/Cd approximately as circuitously via for a few quiet weather NTSLF residuals for HT at Bournemouth compared to UKHO Bournemouth predicted heights and EA tide-gauge heights =0.61 , as not found on the www anywhere )
Bournemouth, 0037, 3352, 1.4m
Lymington (at the first road bridge over the Lymington river), 0040, 1024, 1.98 m
Lymington (In the Solent near the mouth of the river ) (Channel Observatory chart=87), OSD/Cd= 1.98m
Yarmouth 0045, 9226, (1.98m EA 2000 tide tables)
Beaulieu EA 9238
Southampton/Woolston, 0062, 1034, 2.74m (beware this gauge bottoms-out at a "drying" height of about -2.36/-2.37m OSD or 0.38m CD , see 18+19 Sep 2020 and turn of Feb/March 2021, 29 to 31 March +1 April 2021 +28 Apr ?). Southampton OSC/Cd conversion only increasing from 2.73m to 2.74m in the last 35 years, predicted tide heights wrt local Cd having increased in line with sea level rise, see local sea level rise section.
Southampton/Eling ,full tidal but bottoms-out, EA 9263 (the other Eling gauge is on the pounded river side of the tide mill)
Southampton/Portswood sewage plant, EA rainfall gauge E11480
Southampton/Shirley Pond, nearest EA levels monitor for rainfall
on Southampton Common ie high ground uphill of St Denys EA 9240
Southampton/Riverside Park EA 1056, not directly tidal, until there is a serious marine surge as the gauge point at OS SU 44474 15337, upstream of Woodmill Mill , is 80m off the Itchen , in the pitch and putt along the minor path to Marlhill Copse .
Hamble EA 9200
Cowes, 0060, 1020, 2.59m (by the EA , but questionable relating to Harbour Commission gauge, see Valentine's Day 2014 surge height anomaly and direct optical survey comparison to OS benchmark levels near Cowes Town Quay, 2.77m by OS benchmarks or 2.73m by comparing UKHO Soton & Cowes predictions versus Cowes tide gauge readings )
Bembridge, 0054, 1018, 1.66m ( from 2019 Bembridge Harbour guide, was 1.34 in the 1990s), (OSD/Cd approximately as 2021 circuitously via average of a few quiet weather residuals for HTs at Lymington and Portsmouth compared to UKHO Bembridge predicted heights and EA tide-gauge heights = 1.28m ) . So 0.38m different to the harbour guide, make of that what you will. I'll take the use of the term "I believe", by the former harbour master , in relation to 1.66m figure in that pdf, as hinting at being questionable and go with about 1.28 to 1.34m, tending to 1.34 for authority compared to my effort requiring UKHO, Channel Observatory, EA, OS and NTSLF all to be accurate. Also as calculation does not come into any official source, just having access to both OS and UKHO source documentation relating to the height of the same fixed reference in a maritime context . I bet they used dGPS rather than optical surveying for that 1.66 figure, like the local cock-ups in archaeological site 3D co-ordinate referencing.
Ryde , 0058, 9214, 2.78m( EA tide tables for 2000 )
Portsmouth, 0065, 1028, 2.73m (EA 1028 "csv" file contains
EA and NTSLF heights with timing conflict, use with caution, as the lay down order in the file is dependent on the relative difference of the 2 system clocks it would seem. To determine which is which , for a particular tidepoint, pixel count a slackwater height on the ntslf tide gauge plot page and subtract 2.73m from the converted pixel height)
Shoreham, 0081 , 1032, (OSD/Cd 3.27m in EA 2000 tide table, but bear in mind 2.6km separation and peaks are not necessarily in the same quarter hour bin )
Brighton (Channel Observatory chart=88), UKHO 0082, OSD/Cd 3.40m
Arun Platform 50deg 46N 0 29'W (Channel Observatory chart=86), OSD/Cd 3.04m
Newhaven, 0083, 1026, 3.52m
Dover, 0089, 1158, 3.67m
Nice to see that the Admiralty tide table-generator also has difficulty distinguishing low tides from YFS (5 HW in a row), for this morning. Little weather effect (Lymington residual) and VTS giving LW, all approx, 1.5m at 3am and YFS
2.4m at 6am . A lot of difference between 1.5 and 2.2m if moving big ships around or sewerage barges, avoiding low bridges when laden or grounding unladen and unballasted, for that matter near low water
UKHO
Sun 27 Sep 2020 ** GMT ***
LW HW HW LW HW HW
00:48 06:51 10:16 13:18 19:09 22:39
1.9 m 3.7 m 3.8 m 2.0 m 3.7 m 3.8 m
Mon 28 Sep
HW HW HW LW HW HW
04:27 07:54 11:04 14:12 20:08 23:28
2.2 m 3.8 m 4.1 m 1.7 m 3.8 m 4.1 m
Belsize
day 27
time metres
low 2h22m 1.83
high 9h34m 3.95
low 14h32m 1.8
high 22h19m 3.99
day 28
time metres
low 2h53m 1.57
high 10h38m 4.16
low 15h9m 1.58
high 22h31m 4.04
Slope in the Itchen , or not
After about 2 inches of rain for a few hours before the 02 Oct midday high tide with 984mB of air pressure.
Priory Rd hard at noon 4.71m
Woolston noon 4.69m, 12:15 4.66m , 12:30 4.58m
VTS with months on now, must be deliberate degraded 1 decimal readings for the public.
VTS read 4.7m for those 3 readings , so between 4.651 and 4.749m
So was VTS reading 5 or 6 cm too high?
Perhaps the fresh water.lower density, from the Itchen and Test "emergency" sewer overflows and storm drain outputs , at tidal slack water tends to the outside of the roughly curving tidal parts of the rivers, ie on the city centre side of the rivers and so higher water level at VTS on Dock Head?
High tide 13:00 04 Oct at the hard read 4.88m (about 0.4m residual at Lymington) , Woolston at 13:00 read 4.85m . The span of VTS readings of 4.8m and the 4.7m before and after are back to the usual with-in bounds +/-0.02m parity with Woolston.
Re-jigged www VTS
Does not have an underlying tide curve, just an on-the-fly determination of the residual.
Any obvious error in the red line such as on 30 May 2021 is dutifully transferred to the green, any data absence converts to a diagonal not a curve, too many coincident rounding transitions red and green and the form and placement of the YFS curve is always correct unlike UKHO and Belsize tide-curves.
Analysing the graphs over a couple of days, they do not use the residual from the Lymington gauge site or NTSLF for Pompey/Bournemouth.
The algorithm for the "predicted" green curve looks like use the red and green curve difference of 24.75 hours earlier adjusted +/- by the trend from the previous 24.75 hours residual applied to the red curve (or perhaps 12.33 hours semi-diurnal periods as they are rounding to 0.1m anyway). Perhaps thats why the constant high air pressure of 06 to 11 June 2021 red and green VTS curves do not have the near enough constant -0.1/-0.15m residual of NTSLF, Lymington and Belsize , as that algorithm would feed back on itself, removing any constant difference, on averge, ie about half the time displaced one way and half the time displaced the other way as in the VTS graphic outputs of those days.
After long duration outages, it would have to use the red data initially, ie zero residuals, perhaps and I'll have to take a closer look at future minor outages like 07:00 to 07:30 30 May 2021 to see whether an anomaly about 12 hours later or 24 hours later.
Major VTS errors on VTS output, think "Ever Given" in the Suez Canal.
Possible physical rather than electronic reasons of bubble gauge errors, back-flow of seawater into the air "bucket" and condensation of vapour in the air delivery pipe, bio-film and higher surface tension than soap bubble formation in the air pipe, venturi effect on the bubbler output pressure due to imbalance of tide-streams in Test and Itchen at Dock Head although overall being slack water, water density/salinity changes, differential lateral flow of freshwaters from Itchen and Test migrating to the outside of the river channel bends. Unkown reason for 30cm/1 foot errors in the below, perhaps electronic/software/firmware errors.
Comparing VTS output , at the +/-0.1m rounding transitions times to the Woolston gauge, on the rising and falling of the tide relatively slack water at peaks of the tides.
12 June 2021
early am high tide VTS over-reporting by 1cm
early pm tide over-reporting by +21cm
13 June
early am tide +29cm error
early pm 2HW +31cm error
14 June
early am tide +30cm
early pm tide 0 error
15 June
1 or 2 cm difference.
Return of major errors
07 August, +1,+19cm; low tides on 07 Aug, +2, +12cm
08 August, +30cm, then they pulled the plug
09, VTS outage
10, VTS outage
11, +34cm 1 tide recorded
12, +32, +31cm
13, -5,-5cm
14, -2, -5cm
15, -7, -6cm
16, -4, +2cm
17, +1,+1cm
18 +2, +1cm
19 , 0, +2cm
20 , +1,+2cm
21, , +1, +4cm
22, +1,+5cm
23, 0 , 0cm
...
drifted back to a consistent norm of about +6cm
until
01 Feb 2022, +8, +10cm
02, +7, +9cm
03, +9, +7cm
04, +11, +6cm
Stealth Surges
Another one to add to the ones bouncing off the Pas de Calais from strong WNW wind passing over us.
Even more stealthy , although this wind did pass over us early evening, it would not be necessary next time and so a chance of a fully stealth 0.6m surge on a 5m tide sometime, with NTSLF down.
From strongish, 47mph average, SSW wind passing over Brighton to Beachy Head coast, slightly curved so maybe a bit of focussing and the Seine Bay very crudely a curve.
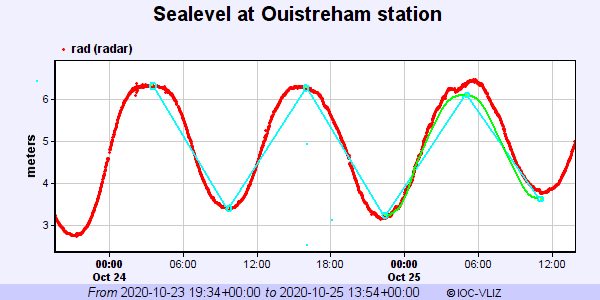
My analysis for Ouistreham in the bay of the Seine north France.
Firstly I forgot to say before, NTSLF had the timing of the mystery surge 25 Oct as noon both at Pompey and Bournemouth suggesting the surge was coming from the perpendicular bisector direction of the line between Bournmouth and Pompey, so to that bay on the French coast.
All times below are GMT, using the IOC tidegauge plot and superimposing a tide curve. Times and heights from a www source, www.tide-forecast.com / Meteo365.com ,
seems good enough for this purpose. The blue circles on the attached graphic, 3 on the IOC curve of 24 Oct and the fourth a bit above the IOC curve as the wind off-shore SSW , would have locally depressed the tide a bit then. Blue lines and the intercepts to the red tide gauge plot scaled for the intercepts on 25 Oct and 4 simple "elastic " green curves visually fitted between those points to look like the curve of 24 Oct.
Required locally 1.28m adding to the Ouistreham heights , for the IOC GPS Geoid offset or whatever for their world standardised curves.
From Brighton tide gauge peak a very unconvincing 0.39m at 20:50 24 Oct , as lot of storm jitter, probably more like 0.3m .
Newhaven 0.29m peak at 20:50
Ouisterham peak from my plot 0.5m at 06:15 25 Oct
Pompey peak 0.62m 12:20
Lymington peak 0.6m 12:10 to 12:40
Bournemouth peak 0.5m 12:00
So 6 to 7 hours for each crossing of the Eng Channel.
Re-examining recent minor surges, the mysterious stealth surge tide of 11 Dec 2019 , VTS peak of 5.14m , Pompey residual 0.66m was an earlier example of double reflection surge IMHO. The peak of SSW 44mph wind passing over Brighton to Beachy Head coast was at 5pm 10 Dec, arriving here after reflecting off the Ouistreham coast , about 17 hours later.
The 25 Oct 2020 example was a 15.5 hour delay to arriving here.
Enclosed is top of the tides for the last week up to 08:30 this morning, the "reflection surge of late 27 Dec 2020 stands out, a stealth surge with no accompanying whistling telephone wires or clattering halyards. Unfortunately I've not managed to find any academic study on reflection surges or even what they offically call them, let alone any insight .
Enclosed also, is my residual composite of the IOC tide-gauge record of Dieppe, GMT times and heights as IOC minus 2m. Combining tide table times and heights with the IOC record , taking the red ebb and flow plots (vey double-lancet shape, rather than sinusoial) of 26 Dec , changing to green and hovver elastic transparent copying into the 27 Dec area on the tide-table data points.
I tried doing the same for Ouistreham but no surge emerged, neither so for Boulogne. I suspect the main surge would have been the Etaples area but no "maregraphe" or record found for that area, making do with the Dieppe record.
The gales of the morning , going parallel to their coast showed no surge or jitter in their record to speak of the early hours.
For the Dieppe area the gale was over by 08:00 GMT, less than 20mph at the peak of the local Dieppe surge. Jitter and surge on that Dieppe plot I'd say was from the earlier SW wind driving water into the Brighton to Beachy Head coast and reflecting off towards France.
Brighton surge of about 0.4 to 0.5m 04:00 to 06:30 GMT.
Dieppe surge of about 0.5m 08:00 to 10:00
Solent area surge about 0.6m from 1034 gauge, Lymington and Pompey gauges about 21:00 to midnight 27 Dec, so about 3/4 of a day later.
Was too late to grab the tide-tables for 26&27 Dec for Boulogne but adding 30 minutes to the times and same heights as Dieppe is not far off.
Its a pity NTSLF does not have an explainer of some of the less obvious positive and negative lumps and bumps on its outputs.
Storm Arwen 26/27 Nov 2021 , still no resolution of whether
IoW can get reflection surges from NW/NNW wind reflecting off the Seine Bay
area of France.
I did not fit tide-curves so unknown peak surges.
For their am low tides 27 Nov
Ouistreham +0.64m surge and Le Havre +0.37m surge, so if there was a reflection surge off their coast, it was nullified by the
continuing lesser north wind of the afternoon in the Eng Channel
EA surge warnings for Southampton.
From analysing a number of such warnings. They determine the expected surge for Soton 1HW by taking the average of the displacement in the surge curve 12 pixels after the appropriate high tide point of Bournemouth NTSLF surge prediction and 4 pixels before the Pompey high tide value of the curve. Of course the EA would not have to do
pixel-counting like us.
Storm Alex ,Sting Jet of 01 October 2020
With input from a couple of ,less/more? amateur than me, meteorologists in more weathery parts of the country. ie correcting a previous version of this summary and no comment to the following version.
Enclosed image is for 22:15Z 01 Oct showing red dots of a/the? sting jet caught on 22:15 Infra red satellite image with similar linear track on the images 1/4 hour before and after. L is the rough position of the Alex low centre at 22Z and N is about where Noirmoutier is, green dots is the approx low level track under the cloud.
Notes for next time.
In the model plots beforehand
Spirals in 1.5PVU , 500HPa temp, 850HPa , and TPE/Theta-E and "bicycle-pump warming", deepening of the associated low of 1 to 2 mBar per hour , in the 2 hours before the highest surface winds, only suggest a baroclynic cyclogenesis.
Time and place of the most extensive patches of <400dam 1.5PVU plots or lowest sub 400 dam, is not suggestive of where or when a sting-jet may emerge.
Banded arc patterns in met model output simulated IR satellite images may suggest sting-jet/s possibility.
Near real-time
More certainty of sting-jet/s
Above 2mBar per hour surface barometric deepening in the preceeding 2 hours .
A dark (dry air ) line in IR satellite imagery , close to and parallel to the modelled jetstream for that time and track , connecting to a dark part-circular patch contained within a hook of cloud.
Any jet emerging , after circulating or part-circulating in that dry circular area, near the surface low , could be in any direction and as much as 120 miles (Storm Alex case) from the low, usually to the SE of the low (northern hemisphere).
For Storm Alex 01 October 2020, from the models and auto-generated synoptic charts I use.
Models showed 5mB drop in 2 hours , 19Z to 21Z , and "realtime" showed 9mB drop in 2 hours from 19Z to 21Z.
Linear dark feature in the circa 22Z IR sat image,
parallel to modelled 70Kn part of the jetstream over Rochefort to Nantes to Reines connecting with a darker semicircle encompassing Reines, Lorient and St Nazaire. Jet emerging near Isle Noirmoutier , about 120 miles from the low centre, heading about ENE, so rotating about 270 degrees , or going by a cloud image I saw on the BBC (real sat image or from a graphics package unknown), rotating 1 or more turns plus 270 degrees.
Data from hourly synoptic plots, so their subset of Metar data
Highest mean winds in the area of the Low
19Z 25Kn
20Z 30Kn
21Z 45Kn
22Z 25Kn
Additional data from one of the contributors using TAF/Metar feeds
100 knot gust on the SW Brittany coast with plenty at 60-70 knots inland.
Highest mean speed 65 knots off the coast at 2200z, close to Noirmoutier. Overland track, north of Nantes to Angers in the hours after midnight 01-02 Oct.
Double high tide cross-comparisons
October 2020
day 2
time metres
high 1h31m 4.44
low 5h27m 0.83
yfs 8h18m 1.58
high 11h53m 4.6
high 13h55m 4.58
low 17h47m 0.84
yfs 20h35m 1.6
day 3
time metres
high 0h8m 4.53
high 2h4m 4.39
Belsize ( 1/4hr readings ) 7min/0.07, 5min/0.05, 7min/0.02, 7min/0.07
2020-10-02T05:30 , 0.86
2020-10-02T12:00 , 4.53
2020-10-02T14:00 , 4.65
2020-10-02T17:45 , 0.90
2020-10-03T00:15 , 4.55
2020-10-03T02:15 , 4.32
UKHO 13min/0.13, 52min/0.35, 20min/0.25, 50min/0.22
Fri 2 Oct ** GMT **
HW LW HW HW LW HW
01:03 04:38 10:47 13:52 16:59 22:55
4.2 m 0.8 m 4.4 m 4.3 m 0.9 m 4.3 m
Sat 3 Oct
HW LW HW HW LW HW
02:05 05:15 11:22 14:12 17:34 23:33
4.1 m 0.8 m 4.4 m 4.3 m 0.9 m 4.3 m
day 3
time metres
high 2h4m 4.39
low 6h2m 0.78
yfs 9h1m 1.73
high 12h29m 4.6
high 14h22m 4.55
low 18h25m 0.92
yfs 21h17m 1.85
day 4
time metres
high 0h43m 4.57
high 2h40m 4.39
Belsize 1min/0.04, 7min/0.04, 2min/0.04, 20min/0.09
2020-10-03T06:00 , 0.78
2020-10-03T12:30 , 4.64
2020-10-03T14:15 , 4.51
2020-10-03T18:30 , 0.93
2020-10-04T00:45 , 4.53
2020-10-04T03:00 , 4.30
UKHO 8min/0.24, 3min/0.21, 12min/0.23, 23min/0.2
Sat 3 Oct ** GMT **
HW LW HW HW LW HW
02:05 05:15 11:22 14:12 17:34 23:33
4.1 m 0.8 m 4.4 m 4.3 m 0.9 m 4.3 m
Sun 4 Oct
HW LW HW HW LW
02:23 05:48 12:23 13:48 18:02
4.1 m 0.9 m 4.5 m 4.4 m 1.1 m
Early am tides processed as the day before, as EA Woolston 1034 and Lymington data is available then.
EA double entries for the Portsmouth 1028 tide gauge CSV files.
I never got a reply to my acknowledged EA enquiry about what the 2 entres meant, for each timestamp.
But 11 August 2022 the graphic and CSV showed correct and incorrect trace/values, coinciding with the same gross errors on the NTSLF tide plot ( as though the NTSLF output was suddenly scaled by x0.1).
So EA CSV files consist of the 2 tide gauge readings at Portsmouth , referred to OSD. On that day the NTSLF values came "later" in the file than the EA one. But from previous exploration of these CSV files , the order can vary on downloading the apparent same data on different days, perhaps a consequence of relative drifting of system clocks between NTSLF and EA .
As there is often a short glitch on either EA or NTSLF, that would give an indication as to which CSV thread applies to which in the future, as otherwise only a few cm difference, less than NTSLF graphic resolution/rounding. As NTSLF one is in the navy dockyard and EA in the sally port, perhaps due to ship movements , then enogh to resolve. Also reviewing the files and plots before the grosse errors, knowing now, the second of each pair was the NTSLF one for those few days, for low tides the EA bottoms out a quarter of an hour before the NTSLF one, but the interval may shorten and disappear or vary between neaps and springs or the seasons. So any "glitches" from ship movements or whatever may resolve the pairs also.
NTSLF errors of the surge predictor .
It was becoming obvious that there are systemic errors in the predictor as it is nowhere near a balance of positive and negative errors. So tabulating the errors for high tides at Pompey predictions and reality, assuming the underlying tide-curves are correct (nothing stands out comparing to Belsize tide-curve for Southampton and the Lymington mouth of the river Lymington tide gauge site.
Then as the EA uses this as their source for marine flooding warnings, under-predicting floods in this area. They in effect use the average of the predicted residuals at Pompey high tide 4 pixels earlier and the relevant Bournemouth high tide 12 pixels later for the EA prediction of surges at Southampton.
Date , Pompey HT surge prediction , Pompey HT surge reality, difference, ABP tide letter
Feb 19 pm, 0.33m, 0.37m, 0.04m , Q
Feb 18 pm, 0.55m, 0.59m, 0.04m, Q
Feb 16 am, 0.29m, 0.44m, 0.15m, M
Feb 13 pm, 0.26m, 0.33m, 0.07m, F
Feb 13 am, 0.20m, 0.56m, 0.36m, D
Feb 11 am, 0.06m, 0.37m, 0.31m, B
Feb 07 am , 0.15m , 0.45m, 0.30m, K
Feb 06 pm , 0.45m, 0.73m, 0.28m, N
31 Jan am, -0.13m , +0.19m , 0.32m ,O
Jan 30 am, 0.17m , 0.54m, 0.37m, O
Jan 27 pm, 0.34, 0.54m, 0.20m, F
Jan 04 am, 0.30m, 0.41m, 0.11m, T
Jan 03 pm , 0.36m, 0.41m, 0.05m, T
Jan 02 am, 0.22m, 0.45m, 0.23m, Q
2021 Dec 28 am, 0.28m, 0.42m, 0.14m, H
2021 Dec 07 noontime, 0.51m, 0.70m, 0.19m, S
Post-Storm Barra 2021, simple average fudge factor = 0.23m, to be added to any NTSLF Portsmouth high tide surge predictions, until the situation improves. It looks like the problem may be due to the rise in mean sea level and that effect on shallow water surges,
not factored in to the NTSLF algorithm structure back in its pre-1999
developement.
Then totally inexplicable the error seems to go with the neap/spring tide cycle but weirdly split into bands, a binary structure of error present or absent. Perhaps there is a harmonic of 7 day period in the Portsmouth tide-curve and a set of odd harmonics of that fundamental that leads to something like a pulse or square wave, with abrupt transitions. Perhaps that then leads to a resonance or something in solving repeated Navier-Stokes. Or the Admiralty use of Shallow Water Corrections, but they are graduated as are seasonal corrections which for Solent ports are very small. Belsize tidecurve uses compound HCs of integral multiples ,sum and difference, beyond the "standard" set to avoid the shallow water "corrections" business.
Except for two ABP "F" tides falling into both camps
Little error 0.1m if the tide letter is G to J or P to Z
The error 0.3m if the tide letter is A to E or K to O
3 out of 4 "F" tides tend to the 0.3m rather than 0.1m error.
Or as Belsize tide heights
Little error 0.1m if 3.95 to 4.14 or 4.35 to >5.0m
The error 0.3m if <3.2 to 3.94 or 4.15 to 4.34m
NTSLF "tide-letter" errors for most of Feb 2022.
The red bars along the top , mid-pm or am start/stops, rather than actual low tide times, going with the ABP tide-letters corresponding to 0.3m errors.
Letter F occured in both camps and still could be either way in the enclosed plot. So it looks like change of ABP tide-letter band presages NTSLF binary error or no-error switch-over by half a day ahead.
No such errors occuring at peak spring tides, a saving grace.
The error/no-error split hopefully will be more apparent on significant surge events.
It looks like F can be included in the error set.
I've come to the conclusion that this NTSLF problem is mainly due to
an erroneous tide-curve for Pompey, presumably not updated for the extra metre of dredging of the harbour entrance for the new aircraft carrier. Comparing predicted and actual NTSLF residuals , the "error" goes sync'd to the tide , so correct the underlying tide and the error would mainly disappear, leaving perhaps just an unaccounted for MSL rise. So I'm in the process of converting the Belsize tidecurve for Pompey.
As the local tide curves can be peaky, the curve-fitter will "connect" to points on the wrong side f the peaks. So initially optimising the phases in collected HC groups , semi-diurnal, diurnal etc withthe same optimised slight phase shift, reflecting the tide-pulse time offset from Soton to Pompey . Then the largest amplitudes, checking every now and then by plotting out, that the curve-fitter is behaving before optimising all phases and amplitudes.
Then monthly calendar of Pompey high tides for then correcting the NTSLF predicted residuals for Pompey in surge situations.
Lower pane is the red NTSLF tide-gauge page of their tidecurve minus the blue tide gauge plots concattenated for the week and the latest Belsize-Pompey tidecurve in black.
From 145 quiet weather datapoints recent and some in 2018 and 9 UKHO predictions for the rest of 2022, 2cm error to those datapoints and 7cm error being the worst. A few days of non-quiet weather currently , so resuming the Pompey curve-fitting in a few days time.
The upper pane is the type "1.3" NTSLF plots concattenated for last week plus the black line. So blue is the NTSLF predicted residual and red is the tide-gauge reading minus their tide curve , continuously.
The black line is the slackwater, high and low tides only , differences between the 2 lower curves subtracted from the red residual curve.
At least it is nmore balanced either side of the blue, perhaps as the Belsize-Pompey tidecurve fit improves, the swings either side of the blue will diminish.
For any surge situation emerging for the remainder of the month , to improve use of the NTSLF surge prediction , the following looks worth trying.
If Belsize high tide height is higher than an upcoming NTSLF tide height on the tide-gauge "tidal elevations" page then add the difference to the surge prediction level on their other page.
If much the same astronomic tide prediction heights then ignore any correction and in the unlikely? event of the Belsize height being lower than NTSLF , then subtract the difference from the surge prediction.
For the moment it looks as though the NTSLF surge prediction levels are correct, but they are combining it with a Pompey tide curve that has not been updated since the deep dredging for the draught of the new Pompey based aircraft carrier.
There may be an extra fixed offset of about 0.1m to the surge prediction values , that comes in at the end of March with change over from GMT to BST , but that would be constant until the change back to GMT. From some unknown datafeed that is uncorrected or double-corrected at those change-overs. From looking at the NTSLF archived monthly plots over the years.
For the rest of March the high tide details of the Belsize-Portsmouth
tide-tables. The latest curve-fit heights, and hence the callendar, are stil a bit high and worst error at 7cm ,also peaking about 2 days out still, in that they peak around 19 Mar but astronomical springs peak is about 21 Mar. With a return to quiet weather about 21 Mar, then
will get back to improving the tide curve for Pompey
I've fashioned a widget to accurately extract the red or blue algebraic data from the graphical NTSLF plots. So 280 datapoints per day (excluding a few where blue over-writes the red, even that has a way round if necessary) for the red NTSLF Pompey tide curve on the "real time" tide gauge plot page.
Plotting the difference between the two tide curves looked ridiculously spikey, so not shown here.
With Belsize/Soton I've never been able to characterise the YFS to match reality , same will be for the Pompey version. The Lymington tide curve is very good on slackwater heights but also has not tamed YFS preditions and 2HW.
As it seems impossible to derrive an accurate, all parts of the tide cycle, tide curve for shallow water ports, I'll only consider the situation at slackwaters.
From that, the EA using the average of the Bournemouth NTSLF surge residual 1.5 hours after their high tide and predicted residual .5 hour before Pompey high tide, had no academic rigour for surge predictions for Soton, just expediency and better than nothing.
So from now on I'm ignoring all the wiggles on the red "1.3" NTSLF plot, except the high tide time points.
Oceanographically the concept of a residual is defined only at slackwaters , high or low tides.
I decided to curve-fit to the NTSLF tidecurve snippets on the tide-gauge plots to know a week in advance of such divergences, BelsizeN,
rather than extracting the data from the red "custom date" section of the tide-gauge page out to the end of the current year. 8 days of high frequency data from previous week ,curve-fitted, predicted about 3 days of this week. Adding 6 days of every tenth pieces of data from this week, barely predicted the next day. So far transferred, as-is, the long period more than 1 week harmonics from BelsizeP . So far have only been optimising the remaining amplitudes , not phases , of the subset transferred from BelsizeP of only > 1cm amplitude compound harmonics.
The "tide-letter" error business of NTSLF predictions seemed to show a split into underplaying 0.1m or 0.3m or so , via wonky Pompey tiecurve.
So in similar vein the above image shows adopting the simple rule of NTSLF high tides within 0.1m of BelsizeP then add 0.1m , if more than 0.15m diference then use the difference between BelsizeP and NTSLF as a correction without the 0.1m.
Varying vertical scales on the triple plot.
Upper image is such a revised version (black curvi-linear line) for the week of 15 to 22Apr high tides only , compared to NTSLF "1.3" plots.
If all was as my theory there, then black should lie on the blue ntslf residual line.
Lower image is just the tide tops of BelsizeP (green) and
NTSLF (black) from the tide-gauge (red) prediction curves for the week 22 to 29 Apr .
Ignore 28 and 29 Apr, I've not had time to curve-fit the latest tide
gauge data into BelsizeP, seriously low predicted heights. 29 Apr will be revisited next week of processing the data.
There is a slight difference between the 3 large corrections on 24pm, 25pm and 26am tides between the middle and bottom images, as the middle plot was using BelsizeP of 2 days previous compared to the bottom image.
NTSLF errors/stealth surges (absent reflected "French" surges from NW wind)
Concerning the significant surge of 5.01m at about Soton 2HW 03:30 21 Feb 2022. NTSLF predicted 0.1m for Pompey, actual there 0.3m. Unknown Lymington as knocked out by Storm Eunice, residual at Soton by Belsize tidecurve, 0.65m.
Started with NW wind on 20 Feb, over us and the Eng Channel. The surge was more evident on the tide-only gauges of Le Havre and Ouistreham, and not Dieppe or Cherbourg. Despite seemingly WNW wind both here and over the channel, rather than NW wind.
Peak here at VTS sustained 68kph at about 7pm, mid channel met model geostrophic sustained 73kph wind 7 to 10pm. Fitting 8 harmonic constants to the tide predictions for that week, for Ouistreham , well enough for this purpose with an RMS error of 0.11m mainly at low tides. Overlaying that to the tide gauge readings showed the peak there about 0.5m residual at 9:30pm 20 Feb, so 6 hours to reflect off the French coast. The peak at St Helier , on the other side of the Cherbourg Peninsular , 0.65m residual at 9pm 20 Feb, but not affecting the Cherbourg gauge noticeably. All this east of Cherbourg surge activity late 20 Feb was in French waters ,so not taken into account by NTSLF.
42mph maximum at VTS earlier that evening, representing the wind over the Channel, was enough to produce a Solent targetted stealth surge of 0.65m, 8.5 hours later at a time of little local wind , 14mph.
That surge then moved out reducing, east and west, to Bournemouth and Newhaven.
"Woodworth algorithm" problem with Portsmouth NTSLF tide gauge
The meaning of the doubled-up EA 1028 CSV files emerged with the outage of the NTSLF gauge mid Aug 2022. Its both the EA and NTSLF gauges for Pompey. Unfortunately the lay down order is not constant,probably dependent on the relative system clocks each quarter hour , but for Aug 2022 the higher reading one of each pairing is always the EA one but peak lows or highs may be in adjascent 1/4 hour pairing, eg "Log of daily average Pompey ntslf errors wrt EA 1028" at top of this file.
Time to go over to Pompey with my auto-level optical surveying gear to establish a truer idea of the OSD to Cd conversion for near the EA 1028 tide gauge site.
Like St Denys with 9 surviving OS benchmarks from 50 to 150 years ago.
Pompey has 11 surviving benchmarks within 50m of the sea in the Old Portsmough area ad OS surveyed to centi-foot vertical precision, beat that hi-tech GPS.
The drift in bubbler gauge readings after a front-end tide gauge (ie local only) outage is probably due to this "calibration" process that would require a number of tide-cycles to stabilise. Then perhaps coincident to BST/GMT changeovers, they introduce a seasonal/half-yearly fudge-factor as mean tide varies wrt mid tide through the year for our non-sinusoidal tide curves.
None of that mallarchy for non-pressure type ,radar or float gauges and ignoring what is hidden in the phrase "levelled accurately into the geodetic network".
From a BODC pdf
"Mid-tide Bubbler
The operation of the mid tide bubbler is similar to that of the full-tide
system, except that the measuring point is mounted at the mid tide
height. This means that the pressure point is only immersed for half
of the tidal cycle. This is levelled accurately into the geodetic so that when the measuring point is exposed as in the photograph it can be levelled accurately into the geodetic network. Once this is accomplished the full tide pressure points can be fitted to match the tidal curve produced by the mid tide pressure point, thereby connecting them to the geodetic network."
A progressive error feeding back on itself it would seem. Perhaps the post-processing includes an out-of-bounds test that introduces deliberately a divide by 10 function, as last weeks output, to make it obvious to almost everyone that there is a problem.
For the recent 24 Aug 2022 low tide , Pompey apparently uniticed/unkilled ntslf error wrt EA 1028, 226mm, so independent of any residual. Perhaps the origin of last years 35cm or so errors with the VTS tide gauge that went unnoticed, passing into the archives.
It looks as though the double/triple low tides of the last week and a bias towards the use of real data off the tide gauge , rather than an inbuilt tide curve and say semi-annual updates, is the Achilles heel of what I'm calling the Woodworth algorithm, still unseen.
Included is the low tide section of my BelsizeP and NTSLF tidecurve comparison (from binary ntslf .png file to accurate X,Y pixel data extraction widget) for 19 to 26 Aug 2022, it emerges more exagerated than the reality shown on the Pompey tide gauge page , with their custom dates option. With only a hint once of a triple low tide, but a definite one showing in the tide gauge record shown in the EA CSV file. No hint of double lows in the ntslf pompey tide curve trace though, just pixel "rounding" jitter.
Non maths snippets from this Woodworth paper
https://nora.nerc.ac.uk/id/eprint/514044/1/woodworth_mtlmsl_jgeodesy_nora_july2016.pdf
with my emphasis twice
...
The 1-minute
values were then used to determine the high and low turning points of the tide, and thereby MHW,
MLW and MTL.
...
The standard deviation of MTL-MSL obtained from the individual years of data provides an
assessment of how well the MTL-MSL best estimate is known. Implicit in the method is an
assumption that there is * NO LONG-TERM CHANGE IN THE TIDE * (or even short-term ones due to dredging,
for example). Such changes are known to have occurred at many locations (e.g. Woodworth 2010)
but are in general much smaller than could affect the MTL-MSL computed here. At locations where
the tide is changing rapidly then a more sophisticated analysis would be required.
...
On the other hand, there are areas where large differences occur over short distances. The UK coast
and that of northern France to the Netherlands provide examples,
...
for some stations there are turning
points that �common sense� would dictate should not be included in the calculation of MTL. In
particular, there are a small number of stations with many more turning points than the ~705 highs
and ~705 lows one would expect in a semidiurnal regime each year; these will be locations with * DOUBLE OR TRIPLE HIGH OR LOW WATERS * .
Log of 4 slack-water tide-turn daily average Pompey ntslf errors wrt EA 1028 (EA radar gauge opticall auto-level surveyed to the Gunwarf Rd , Portsmouth OS benchmark so known to be good), initially EA elevations higher than NTSLF, so recorded as negative, by these differences. Samplings pre-outage and assumed to be normal within-bounds seasonal variation. 2.73m +/-0.005m OSD/CD conversion factor used, from comparisons of 2dp NTSLF readings and EA 3dp matching readings.
OSD/Cd conversion factor of 2.73m.
After 07 Sep 2022, the ntslf gauge is showing higher readings than the EA gauge.
2022
08 Mar, -34mm
15 Mar, -27mm
08 Apr, -33mm
15 Apr, -17mm
08 May, -19mm
15 May, -19mm
08 Jun, -13mm
15 Jun, -13mm
08 Jul, -70mm
15 Jul, -55mm
22 Jul, -56mm
27 Jul, -73mm
04 Aug, -47mm
10/11 Aug, -31mm
ntslf outage
17/18 Aug, -66mm
18/19 Aug, -64mm
19/20 Aug, -56mm
20/21 Aug, -66mm
21/22 Aug, -117mm
22/23 Aug, -145mm
23/24 Aug, -105mm
24/25 Aug, -194mm
25/26 Aug, -167mm
26/27 Aug, -83mm (3 usable EA tide event records only)
27/28 Aug, -120mm (2 usable EA tide event records only)
28/29 Aug, -117mm (1 reading taken from the ntslf graphic plot as not in the EA file)
29/30 Aug, -89mm ( running worst being -136mm for the overnight high tide)
30/31 Aug, -105mm (running worst being -152mm for the overnight high tide)
31/01 Sep, -186mm (running worst HT -217mm and LT -216mm , am of 01 Sep)
01/02 Sep, -214mm (tie worst HT -216mm and worst LT -230mm )
02/03 Sep, -194mm average (running worst HT at -226mm for pm HT 02 Sep)
03/04 Sep, -211mm average (running worst LT at -252mm for am LT 03 Sep)
04/05 Sep, -219mm average, running worst
05/06 Sep , -105mm average of the 4 last slack water tide events, best HT offset 05 Sep evening of -72mm after the previous -210mm LT1 and LT2 resetting the tide-gauge post-processing algorithm perhaps , but too far the other way.
06/07 Sep , transition from negative to positive differences rather than the restricted range of variation of early 2022 , ie now ntslf higher than EA readings .
07/08 Sep, +49mm average
08/09 Sep, +30mm average (worst so far of the positive going regime +72mm LT am 09 Sep )
09/10 Sep +76mm average (worst+ HT +76mm am 09 Sep and worst LT +101mm am 10 Sep)
10/11 Sep +20mm average (worst of the 4, LT +39mm am 11 Sep )
11/12 Sep +24mm average
( an unexpected double low in the ntslf tide gauge record but not the EA record, not on BelP and at a spring tide so perhaps although unlikely was due to a ship movment at low tide, for the pm LT 11 Sep. It may have sent the datum adjuster going negative as the next HT overnight 11/12 Sept error was only +4mm)
12/13 Sep +39mm average (worst was +67mm HT am 13 Sep, both latest HT showed definite, col separating, double peaks with differences of 261mm pm 12 Sep and 373mm for am 13 Sep )
13/14 Sep +27mm average (worst was +48mm LT am 14 Sep, so the double high tides have not disrupted the datum adjuster. The poor red&blue curve tracking on the Pompey ntslf tide gauge page, with zero surge, are due to the under-play ntslf tide-curve)
14/15 Sep +23mm average (worst was +43mm LT pm 14 Sep)
15/16 Sep +58mm average (worst was +71mm LT am 16 sep)
and for the recent high tide , red-blue difference on the ntslf tide gauge page was 0.35m despite next to zero surge prediction and a bit negative for inverse barometer. Of that 6cm was due to tide gauge error and 29cm from ntslf tide gauge error. Unfortunately BelsizeP was just as bad giving 4.4m for this afternoon and it looks like tuesday next week before I can generate an updated BelP tide curve.
16/17 Sep +62mm average (worst was +85mm LT pm 16 Sep)
17/18 Sep +67mm average
18/19 Sep +77mm average (worst was +114mm pm LT 18 Sep)
a triple LT yesterday evening, will that reverse the direction of the error or spur it onwards?
19/20 Sep +108mm average (worst was +144mm , so 6 inches in old money, am LT 19 Sep, still being disguised by high atm. pressure)
20/21 Sep +97mm average (worst was 150mm LT pm 20 sep) , W3=75
21/22 Sep +60mm average, W3=76
The lowest error was for the last low tide am 22 Sep and only +23mm . The latest W3 of 76pix was in the 75pix +/-2mm bin, so perhaps the seasonal norm error for September has arrived .
22/23 Sep +53mm average, W3= 74 pix
23/24 Sep +77mm average, latest W3 = 74 pix so late Sep normal
offset wrt EA 2028 averages out to +53mm
24/25 Sep +94mm average, latest W3=72 pix
25/26 Sep +129mm average, worst +213mm pm LT 25 Sep, latest W3 of pm 25 Sep 71 pixels
26/27 Sep +103mm average, worst +138mm pm LT 26 Sep, W3 a very low 65 pix and for am 27 Sep 69 pix, but the degree of error has not been proportional to the difference to 75 pix.
27/28 Sep +93mm average, W3 latest 68 pix
28/29 Sep +98mm average, worst +132mm LT am 29 Sep, W3 last evening 67 pix
29/30 Sep +103mm av, worst +134mm LT am 30 Sep, W3 last evening 69pix
30/01 Oct, +144mm av, worst +259mm LT am 01 Oct, W3 last evening 73 pix
01/02 Oct, av +145mm, W3 last evening 71 pix
02/03 Oct , av +144mm,worst 250mm LT am 03 Oct, W3 back to 75 pix, errors expected to reduce in the next day or two
03/04 Oct, av +88mm, W3 = 79 pixels, so may move to negative errors over the next day or two
04/05 Oct. av=+119mm, W3=72 below 75 pixel bin again
05/06 Oct, av=+130, W3= 73 pixels, HT error pm 05 Oct was 152mm or 6 inches above the peak recorded on the EA gauge
06/07 Oct, Av= +91mm, W3=76 pix
07/08 Oct, Av= +108mm, worst LT am 07 Oct of +160mm, W3= 73 pixels
08/09 Oct, Av= +109mm, W3=70 pix
09/10 Oct, Av= +104mm, W3=73 pix
10/11 Oct, Av= +90mm , W3 = 75 pix
11/12 Oct, Av=+92mm, W3=71 pix
12/13 Oct, Av=+94mm, W3=70 pix
13/14 Oct, Av= +157mm, W3=69 pix, worst error was 264mm pm LT 13 Oct, unlikely due to ship movement, say , as the error for LT am today was 177mm
14/15 Oct, Av= +79mm, W3=69 pix
15/16 Oct, Av= +83mm, W3= 70 pix (62 pix for pm 15 Oct lowest so far), return to ntslf max/min discriminator picking off YFS as high tides
16/17 Oct, Av= +82mm, W3=65 pix
17/18 Oct, Av= +76mm , W3=83 pix
18/19 Oct, Av= +59mm , W3=74 pix
19/20 Oct, Av= +111mm , worst HT error of +121mm am 20 Oct, W3 =66 pix
20/21 Oct, Av= +181, worst error +247mm at LT am 21 Oct , W3 interpolated for missing data approx 42 pixels, previous also interpolated for missing approx 64 pixels, ntslf max/min discriminator picking off a YFS as a high tide
21/22 Oct, Av= +155mm, W3= 66 pixels
22/23 Oct , Average error +213mm, W3= 59 pix, worst error was am 23 Oct LT of +235mm
23/24 Oct, Av= +231mm, worst error HT +217mm pm 23 Oct and worst LT am 24 Oct +290mm ,W3= 63 pix approaching the worst of the VTS errors middle of last year at 340mm, spurious YFS picked off as a HT again.
24/25 Oct, Av= +283mm , worst error this morning LT of +355mm (more than a foot) last HT error of 253mm and W3= 62 pixels . That gauge has now reached the unrecognised? error , well still in their archives, of the VTS bubbler gauge last year.
25/26 Oct , Av= +288mm, worst LT 338mm, worst HT 249mm, W3 = 60 pix and a saddle between a double LT or YFS interpretted as a HT by the pick-off
26/27 Oct , Av= +289mm, W3= 65 pixels, worst HT +260mm overnight
27/28 Oct, Av= +307mm, W3=61 pix, worst LT +377mm am 28 Oct
28/29 Oct, Av= +230mm, W3=68 pix, worst LT +327mm pm 28 Oct, may have peaked , the dark blue line on the EA 1028 graphic is thinning
29/30 Oct, Av= +166mm, W3=65 pix
30/31 Oct, Av= +210mm, W3= 69 pix , worst LT am 31 oct at +241mm
31/01 Nov, Av= +199mm, W3=59 pixels
01/02 Nov, Av= +46mm , W3 = 75 pixels , return to normal seasonal temperature/salinity/density offset ?
My guess is that the high air pressure " glitch " just before LT1 was someone, at the start of their shift, giving a blast of compressed nitrogen into the bubbler lines and it dislodged gloopy/viscous bio-film/slime/foam/bubbles (maintaining artificially high pressure inside the delivery pipe ) . Since LT2 yesterday morning , normal pressures it would seem. But probably biological contamination still lingering in the pipework and a return to such errors is possible with water backflow through the outlet vents, or even inadequately de-humidified air use in the air delivery system , if air rather than pure cylindered nitrogen is used.
Does not explain lower pressure offset periods, but that could be simply condensed water from badly dried air delivery or simply back flow water from the sea into the pipework. On second thoughts it depends which bubbler pipe , the foam or the water is inside, the full-tide and half-tide pipes would have opposite effects.
02/03 Nov, Av=+47, W3=76 pixels
03/04 Nov, Av= 32mm, W3= 73 pix
04/05 Nov, Av=+22mm, W3=71 pix
... (not processed as stable error)
09/10 Nov, Av= +36mm, W3=67 pix
10/11 Nov, Av= +39mm, W3=71 pix
...
13/14 Nov, Av= +61mm and error on the LT am 14 Nov was +89mm, W3=73 pix
14/15 Nov, Av=+ +49mm ,W3=67 pix
15/16Nov Av=+17mm ,W3=61 pix
16/17 Nov, Av= +60mm, W3=68 pix , or 10 or 27 pix because of intrusion of peak between LT1 and LT2
17/18 Nov, Av= +81mm ,W3=68 pix, worst error LT pm 17 Nov of 154mm
18/19 Nov, Av= +81mm, W3=72 pix, worst error LT pm 19 Nov of +114mm
19/20 Nov, Av= +90mm, W3=67 pix
20/21 Nov, Av=+75mm, W3=67 pix
21/22 Nov, Av=+99mm, W3=69pix
22/23 Nov , Av=+88mm, W3= 60pix
23/24 Nov, Av=68mm, W3=69pix
24/25 Nov, Av=76mm, W3= 70pix
25/26 Nov , Av= -33mm , W3=72pix , The ntslf tide gauge is now reading less than the EA radar gauge, maybe something to do with the bogus HT circle appearing on the ntslf surge plot between low tides? am 25 Nov.
26/27 Nov, Av= -41mm, W3=71pix
I've called the datum-transfer horizontal line part of the tide-curve at 3.0m OD of the ntslf Pompey tide gauge plot W3 after Woodworth mid tide bubbler nominal 3.0m zero-seawater air-pressure level (actual height OD or Cd not seen anywhere) There seems to be strong correlation that the set/reset length of W3 is 75 pixels +/-2 pix, or 6 hr 25 min.
So far, negative error values out to 83 pixels and positive error values out to 68 pixels .
So signum(75-W3) gives the sign of the error wrt EA 1028 gauge but no correlation with its magnitude, that seems to be simply about 18mm per day average increase until reset to the low seasonal norm figure when W3 returns to close to 75 pixels.
Numerous double low tides recently ,even a triple, but W3 is still 71 pixels so continuing positive regime errors. Apparent recent dip in magnitude probably due to the multiple lows and highs with different but close timings on the 2 tide gauges , confusing things.
Portsmouth EA 1028 tide gauge.
pics of the EA 1028 tide gauge on Spice Island/The Point , old pompey. Don't expect it to be working much longer as there is no steel cage around it so the boat in the image or any other at high tide and propwash from very near WightLink ferries, wind, drunk skipper or whatever can bash into the polyprop pipe containing a presumed radar gauge. Its been bashed from the seaward side at sometime dislodging the brick marked B and the bolt now in mid air, leaving just one bolt in the brickwork. Funny little access gate, between A4 and A3 size, made from steel piping for access to the top cover marked T. For calibration the radar unit would be swapped out with a testing-lab recalibrated unit, fixing to (at one-time) datum related fixings at the top of the stilling well. I'm assuming the stilling well acting as a wave guide and the radar beam able to propogate both ways via the smoothed joggle half way down, reliably.
Good news on my OS benchmark validation 25 Aug 2022 of the EA 1028 gauge.
I took sea level readings at Viviers Fish outlet at Camber Quay opposite the Bridge Tavern pub. In an iron step ladder recess into the formwork cast concrete of the quay. Between 5 and 7 readings in each 1/4 hour
My average readings, upside down wrt EA gauge
GMT, Mine m, EA m OSD
10:00,1.305, 1.58
10:15 , 1.234, 1.589
10:30 , 1.189, 1.625
10:45, 1.211, 1.583
11:00, 1.245, 1.551
Differences
71, 9mm (sic, may have been a WightLink movement then, time not noted)
45, 36
Peak before 10:30 output, for me the minimum reading at 10:17 GMT
22, 42 (Wightlink ferry movement in this period)
34, 32
Unsure what to make of those spreads so simply taking the 10:30 readings minus 26mm offset for my temporary bridging support for my measurements
Sea level 1.625 +depth below quay 1.163+ Eye height of auto level at quay 1.63m + offset at lampost intrmediary 0.56 = 4.978m
Offset at Gunwharf Rd benchmark 1.04m. So that quayside height 2.788m OSD or 5.52m Cd
Using an old but locally calibrated to +4mm in 100m auto-level, set midway on the long leg along Gunwharf Rd.
So bench mark height measured 4.978 -1.04= 3.938 by this circuitous route, rounding to 3.94m .Repeated accuracy of optical readings about 3mm each time and nominally flat concrete surface so perhaps about +/- 2cm, for better accuracy would require an incised mark or similar at the quay, better stilling well (note to self: strong magnets attached to the tube to attach to to a couple of the iron ladder rungs and DVM continuity beeper/reistance for Rabone-Chesterman survey tape measurement, rather than ultrasonic or "laser" tape measure ) and more readings per 1/4 hour. For the record 6.4m mud depth below quay top , main sight line along Gunwarf Rd about 1.6m above pavement level at the lamppost adjascent to Camber Quay and 1.4m above pavement at the benchmark.
In the Pompey library OS 1960 map showing the benchmark with second geodetic levelling of OSD as 13.20 feet so 4.02m
Internet reference to that benchmark as 3.974m presumably as third geodetic levelling OSD. So nothing in it to speak of, 3.97m v 3.94m.
About the same with the local 5.0m CD level at the hard, levels surveyed in from the church benchmark and the acid-etched blue granite agregate concrete pillar of the Cobden Bridge benchmark using the Itchen at a high tide
Now it depends on what a "self calibrated" working
NTSLF gives for CD/OSD conversion but going by the top of this updated errors listing, an offset of perhaps 3 to 5cm
West going surge 01 Oct 2022
No EA warning for pompey as with their information , the total tide was expecting to be less than 5.1m.
Assuming the NTSLF prediction of surge for Pompey was correct, then the extra 0.17m was the reflection surge from the French coast more south of us, so not on the ntslf bathymetry considerations, focused to the solent area .
The west going surge that ntslf did predict was reflection off the Pas de Calais end of the channel , so in the ntslf bathymetry model.
Bournemouth ntslf nonsense , Oct 2022
Its beyond me why 0.38m surge for Soton by the EA midday 26 Oct.
Probably GIGO and removing the human from the loop as with the bubbler gauges. Even going with the nearest peak in the surge predictions averaged for Bournemouth and Portsmouth gave only 0.29m .
The 12 pixels after Bournemouth HT and 4 pixels before pompey HT would be even less , assuming you knew when HT was at bournemouth.
This in-effect 4 and 8 pixels calculation business is done by the machine before being presented to the display of the EA bod at Exeter Meto HQ, so no human "interference" in that process. Then the figure would be nodded-thru to pro-forma pages for each EA potential flood warning site.
All this week, continuing to at least 30 Oct
https://ntslf.org/storm-surges/latest-surge-forecast?port=Bournemouth&chrt=4
the dark grey crcle HT pick-off placings are anyone's guess as to what underlying tide curve the ntslf has, and so corrupting the process ,unseen. Worst case anywhere yesterday of the surge prediction for Bournemouth could not have given 0.38m , let alone higher for the averaging with pompey to give 0.38m. 30 Oct it was outputting HT circles for everything else other than the reality HT.
Or they are no longer using that 4 and 12 pixel fudge for interpolating any surge for Soton, roll-on the next EA outing to Soton to check.
Yet another problem in this whole marine flooding area to be aware of
The rolling average of , 7 examples of this fudge if the Beaulieu alert on 09 Mar 2023 , like EA Cowes alerts is also used for
Southampton water, then the rolling average fudge factor is 0.14m.
Update for 02 Aug 2023 , and EA alert for midday surge, pixel counting fudge for Soton was 0.43m , the EA alert surge value for Soton was 0.63. So the extra factor was 0.2m ie about the UK MSL offset evaluation for June 2023.
They may be using that figure added to the pixel counting business
, otherwise the rolling average for the eighth such example is 0.15m.
They would seem to be implying the NTSLF surge predictions for Portsmouth and Bournemouth are too low by 0.15 to 0.2m and their tidecurve predictions for Soton are correct. For 02 Aug 2023 they had the astronomical tide for Soton as 4.54m , wheras Belsize tide curve had 4.65m, timing predictions were 12:03 EA, Belsize 12:11, ABP 12:14, UKHO 12:14, Woolston EA1034 tidegauge (1/4hourly readings) 12:00 to 12:15 BST.
I've gone with saying the NTSLF surge predictions are correct and a 0.15 to 0.2m figure has to be added to UK MSL, anomalously higher recently.
The increase in frequency perhaps due to the recent anomalous increase of mean sea level around the UK , rather than increase of number or severity of storms.
Search on my database of EA Woolston tide height csv files peaking greater than 2.4m OSD ( 5.14m Cd) from August 2019 to end of 2024 .
Date and GMT time , height OSD (height Cd)
2019 end of, none
2020 none
2021-12-07T12:45:00Z,2.658 (5.40)
2022-02-18T11:30:00Z,2.505 (5.25)
2023-03-10T00:15:00Z,2.533 (5.27)
2023-03-22T23:30:00Z,2.452 (5.19)
2023-03-23T11:45:00Z,2.565 (5.30)
2023-10-27T21:30:00Z,2.454 (5.19)
2023-10-28T10:00:00Z,2.536 (5.28)
2023-10-28T22:15:00Z,2.591 (5.33)
2023-10-29T10:30:00Z,2.584 (5.32)
2023-11-02T00:15:00Z,2.601 (5.34)
2023-11-02T04:15:00Z,2.624 (5.36)
2023-11-14T10:45:00Z,2.438 (5.18)
2024-03-28T12:30:00Z,2.54 (5.28)
2024-04-08T10:15:00Z,2.48 (5.22)
2024-04-08T22:45:00Z,2.96 (5.70)
2024-04-09T01:00:00Z,2.91 (5.65)
2024-04-10T11:30:00Z,2.41 (5.15)
Eling (as Woolston down)
2024-08-23T00:45:00Z,2.43 (5.17- 0.05)
The threshold trigger level for EA alerts for lowest parts of Southampton Water would seem to be 5.0m total tide , lowest levels for EA warnings were for 5.04m on 08 Dec 2021 and also 02 Nov 2019.
The EA alert trigger level for the Camber area of old Portsmouth would seem to be also 5.0m , getting alerts for 02 Nov 2019 for 5.0m and 07 Dec 2021 for 5.08m
10 Mar 2023 no EA flood alerts for the 5.3m total tide at Soton and 5.4m at Pompey again. NTSLF surge prediction was about correct
but when added to too low EA tide curves for both ports by 0.3 to 0.4m
then their alert trigger levels not reached again.
31 Aug-01 Sep 2023 no alerts for Soton with midnight actual tide of 5.12m and no alert for Camber area of Pompey with a noon tide of 5.23m
Validity of Belsize tide predictions
I decided to run the 2022 tide callendar widget with the most recent Belsize tide curve of a Nov 2022.
I'm proud to say that my lockdown project agrees very well with the hidden EA tide curve for Soton, only emerging in any Soton flood alerts. The sort of reliability presumably matching reality (3way QC weekly checks), like the ABP blue yearly tide books of the 1980s when the data processing was done at Birkenhead, not locally in house.
EA only quotes one height off their tidecurve, presumed to be the highest.
Date of EA alert, highest HT height diff, time diff of HT1 , time diff of HT2
24 Nov 2022, 1cm, 5min, 17min
23 Nov,2cm, 6,18
08 Nov, 4,1,15
07 Nov, 2, 6, 11
26 Oct, 5, 0, 13
09 Feb 2024, 24cm, Bel single tide 15min
10 Feb 2024, 19cm, Bel single tie 15min
For 2023 Av height diff 3cm, 1HT av 3.6min, 2HT av 15min
For 2024 so far, Av height diff 22.5cm, 1HT only, Av= 15 min
2023 EA on strike and only pro-forma straight off the computer junk alerts.
But then
02 Aug 2023,11cm,8min,17min
The alerts for Mansbridge so far to 19 Jan 2024 usually have one height value in each alert rather than two and although mentioning "forecast tide" they may be total tide rather than astronomic predicted tides , so the following on timings is fine but heights may be erroneous.
By considering NTSLF Pompey surge predictions and consistency of differences for Pompey + and - surges at those times, it looks as though the single values mentioned were in fact the astronomic heights.
05 Jan single HT 14min difference, 6cm lower than Belsize (NTSLF +0.05m)
06 Jan single HT 7 mins, 26cm lower (NTSLF surge only -0.03m)
16 Jan, 6min, 0min , 14cm lower (NTSLF 0.0m )
17 Jan single HT 2min, 10cm lower than Belsize (NTSLF about +0.2m)
18 Jan single HT 25min, 12cm lower (NTSLF about +0.2m)
18 Jan single HT 0min ,19 cm lower (NTSLF about 0.08m)
19 Jan single HT 4min, 23 cm lower(NTSLF about 0.02m)
19 Jan single HT 6min, 27cm lower (NTSLF about -0.1m)
20 Jan single HT 33 min, 26 cm lower than B (NTSLF about 0.0m)
20 Jan single HT 38 min, 30cm lower than B (NTSLF about -0.08m)
21 Jan single HT 37 min, 10cm lower than B (NTSLF +0.13m)
With the surge situation tomorrow another chance to check what they mean by "forecast tide" and "forecast at", another parameter to add to this listing and plot out sometime, to unravel.
Average for 2024 from 11 datapoints so far, for future considerations of EA alerts/warnings , 18.4cm EA lower than Belsize highest of HT1 and HT2 heights, ie if Belsize heights are correct at that time, add 0.18 m to any EA height mentions.
I'll only be quoting Belsize predicted heights and times rounded to 5 minutes.
Unfortunately, from the floodassist archive of EA alerts for Pompey , the EA uses a lesser grade of tide curve, perhaps just tables
Unfathomable EA alerts
I cannot make sense of the EA alerts for Cowes compared to Soton
Tabulating the recent ones (on floodassist.co.uk)
date, Cowes total tide and surge, Soton total tide and surge
24 Nov 2022, 4.64, 0.19m,5.32, 0.43m
23 Nov, 4.75, 0.42, 5.19, 0.42
08 Nov, 4.77, 0.37, 5.16, 0.34
07 Nov, 4.70, 0.40, 5.20, 0.41
26 Oct,4.77, 0.38, 5.22, 0.38
So near enough the same surge for Cowes and Soton but not the latest 24 Nov 2022 one , despite mention of waves for Cowes, it is less.
Whenever I do a spot comparison of EA 1020 and 1034 gauges , both referenced to OSD, their peaks are near enough 0.2m different.
Whenever I compare CHC and EA gauge, near enough in the same part of Cowes, they agree using a 2.73m conversion factor. My factor, levels surveying back to OS benchmarks in Cowes came to 2.77m , so effectively independently confirming that.
But the EA is still using 2.59m conversion, but even that does not explain the 0.5m to 0.6m differences in the quoted total tides for Cowes and Soton. Perhaps their spreadsheet has confused predicted astronomic tide and predicted total tide, I know I have done that before, or its confused Yarmouth or somewhere else with Cowes perhaps.
ABP and UKHO Southampton tide table errors, continued
For the recent high tide, we all agreed on a time of 11:30.
It was 4.97m at the hard and a peak of 2.19 OSD or 4.93m Cd at Woolston, so normal higher local HT offset there (so validating the Woolston reading).
Belsize had 4.94m prediction
21 Feb 2023 11:30 high tide.
It was 4.97m at the hard and a peak of 2.19 OSD or 4.93m Cd at Woolston, so normal higher local HT offset there (so validating the Woolston reading).
Belsize had 4.94m prediction
It looks as though the NNRCMP Lymington tide curve is low by about 0.2m giving their recent HT residual of a very unlikely +0.18m, maybe has been the case for some time.
Quiet weather and simple local inverse barometer was -0.05m residual and NTSLF had -0.05m for pompey with the North Sea disturbance having passed, so probably -0.05m residual for Soton and so an underlying actual Soton tide peak of 4.98m at Woolston.
But UKHO predicted 4.7m +/-0.05 along with ABP, so about 0.3m too low on a peak spring tide, problematic.
Much the same for 22 Feb 2023
, quiet weather , NTSLF pompey residual of 0.00m and simple inverse barometer of +0.02m , so again ignoring the Lymington HT residual of +0.22m
HT1 at 12:15 Woolston had 2.24+2.74= 4.98m
At the hard the peak at 12:15 was 5.00m, cars over the lowest drains but the carpark drain showed Itchen water -0.26m below the grill, the EA remote sewer level monitor still in place and no standing or flowing water seen, with a torch, in there at this high tide.
Belsize predicted 4.97m
Again both ABP and UKHO had 4.7m predictions,ie a foot too low.
Lymington tide curve over a couple of weeks mid Feb 2023 , compared to NTSLF-pompey and Belsize and quiet weather inverse barometer was
probably 0.2m too low at high tides for much of the time.
10 Mar 2023
Bit of a surprise seeing the tide gauge output of Lymington HT last night. A jump of half a metre in 20 minutes.
Not as dramatic on EA Lymington and Yarmouth gauges. Seems a bit of a coincidence for a bit of kelp to be blown upwards against the stepgauge for a few minutes right on peak tide,or an electronic glitch on 2 readings; that new "island" so-called Lentune at Hurst Point generating a short term local gyre/eddy with raised water level near the jack-in-the-basket tide gauge but not going up the river to the EAgauge at the first road bridge?
Coincident with the sea undermining a major wall of Hurst Spit Fort recently and the long term abyss just east of the spit , in the area
out to the Jack in the Basket dolphin or whatever the off shore Lymington tide gauge is sited on, abyss generated by kolk/eddy over a much longer time. The NNRCMP Lymington tide curve is also recently
erroneous at this precise time of first high waters, being too low, leading to inflated residual readings then.
Nurdles Stratigraphy
Unfortunately EA 1034 was outputing very delayed gauge readings then.
So my sample swathe was 10cm wide but equal horizontal sections rather than equal 0.1m steps.
High tide came out to be 4.50m 05 June 2023 (since changed by the 02 Aug 2023 5.14m tide), for a patch of local R Itchen beach
4.50 to 4.54m Cd , no nurdles
(the earlier overnight tide was 4.55m so nurdles are not routinely deposited afresh from the wider Solent, requiring floating of existing strand lines it seems)
to 4.61m , 2 nurdles
to 4.67m, 3
to 4.77m, 4
to 4.87m, 9
4.95m, 276 nurdles (probably deposited on a 4.9m tide 23 April 2023)
4.97m, 263 nurdles
4.98m , 262 [14mm leaf litter depth, not including for wood,roots,oaktwig etc]
5.09m ,452 [27mm depth of leaf litter]
5.14m, 315 [24mm leaf]
5.16m, 745 [ 40mm leaf] (probably deposited on 5.22m tide 21 Aug 2020 )
5.21m ,370 [55mm ] (Smiths Snaps packet best before 15-02-2014 and Walkers crisp packet made 09-05-17 and best before 07-10-2017, nurdles latest probably deposited on 5.31m tide 04 Jan 2018)
5.30m, 70 [ 29mm ] (Cadbury Dairy Milk wrapper , best before date erased over time but a promotion tied to the olympics so 2011 and at least 2012 )
Beyond this point the leaf litter depth is much deeper ,becoming 20cm before hitting gravel, by the 5.77m level. So only small test pits made to see if there were any nurdles turning up in the leaf litter or none.
5.33m , a few nurdles (a very degraded crisp packet with best before date 10 Jun ?0, probably 1980 as no barcode, best before print but lost date and part of a postcode)
5.50m (from the WSG site ,detailed below, and scaled to 10x20cm 39,000 nurdles, half a mile further along the Itchen so questionable comparison for 14 Feb 2014 deposition )
5.53m , a few nurdles
5.63m , a few nurdles
5.76m , 1 nurdle
5.77m, no nurdles
Next exploration will be for anything left of the 1924 strand line,
bits of cork,tarry lumps, charcoal, hemp rope? , coal,coke, rubber . bakelite and celluloid too dense to float.
Revisited 10 Aug 2023 , 02 Aug 5.15 tide had altered the previous lowest strand lines. Continued going up the slope to 6.15m Cd.
At the ground level rather than within leafmold, the last level any nurdles found in a 0.1m wide strip was at 5.69m perhaps representing the tide level of 17 Dec 1989. A single piece of expanded polystyrene ceiling tile at 5.83m , so after 1956 of their first use and 1989 so perhaps represeting the tide level of 20 Dec 1983. Or as no obvious strand line with it, perhaps blown in later and animal activity buried it, as no very soot-black bits of decayed oak twig and acorn cups, found in the anoxic conditions of the other lower old strand lines.
From the bits of non-natural deposit on the slope of the ground, I decided it must have been a convenient dumping site for when the bombed remains of Itchen Ferry was bulldozed about the time of WW2 so no chance of a 1924 strand line. Bits of concrete, brick , pebble-dash rendering (appearing in 1920s), plain wall tile, thick glazed shard of a ceramic kitchen dish with flat base of 4 inch diameter. Also a piece of molded glass that would have been about 3 inches in diameter with a retaining flange , perhaps was a bit of Supermarine seaplane or Spitfire taillight lens or off a vehicle.
It looks like on elevated tides all leaf litter and nurdles are refloated leaving an open mesh or net of ivy stems and roots, floating in the water column, that have fully imprisoned earlier large area floating items like crisp packets from earlier floods . So in 2014 a crisp packet could be caught in the stem+root mesh on a rising tide , well before reaching peak tide . Checking the tide line at at Atherington near Littlehampton Aug 2023 , not a single nurdle seen on the recent strand line or earlier higher ones in half an hour of searching, just many small white shells exactly the same size as nurdles but easily crush to dust between fingers.
For a visit to Lymington in Sep 2023 only 2 nurdles found in half an hour of inspecting recent strand lines but plenty of boat paint scrapings.
The WSG site.
Opposite the Yacht Tavern , between WSG car body repairs and the Griffon hovercraft works is an abandoned slipway. Enclosed is a pic,
the lack of weeds in that area due to underlying concrete , but still a phenominal amount of nurdles, as at 5.50m Cd with nurdles on slightly higher ground but covered in weeds and rubbish, deposited 14 Feb 2014 presumably .
The easy to sample area at that image was part of about 2 x 3m but weed and rubbish over the rest of the site , including to slightly higher ground with obvious nurdles in the leaf litter etc.
Pushing in a builders trowel horizontally and pushing in a small bean can , obtained a sample. So 6.5cm diameter can had 2032 nurdles in it and if similar over that 2x3m then 3.6 million nurdles just in that patch to refloat off on the next 5.6m tide.
Update, all the above is reset by the 5.7m surge tide of 08 Apr 2024.
Close run thing, Storm Ciaran 02 Nov 2023.
Peak around HT1 at the hard was 5.44m (Woolston 5.34m) and then close to HT2 , not observed at the hard but measuring 5.36m at Woolston.
I'd forgotten the street lights go off at 01:00 and also forgot to lay my torch near the ground to illuminate the water.
Limit of water on the left under the bumper of the second-rightmost car parked at the ex-priory glassworks, new housing.
So image of sorts about 01:30 after the burst of rain.
The level of the Itchen at the hard peaked at 5.44m about 12:30 and the flap valves kept the level in the road drains to about 5.0m but then the rain burst was tide-blocked.
Very noticeable fountaining of water coming up thru the lowest drain grills, from the wider road catchment area. No smell of sewage with this storm drain water unlike previous 5.4m daytime flood in aug 2020 .
Level in the road reached about 0.1m, above the crown of the road at the dip at the hard, so about 5.3m Cd.
I've a screenshot of VTS at 00:20 showing 5.3m and 1.29m residual.
The residuals for Lymington as black ,Southampton green as EA1034-Belsize, Portsmouth red as EA1028 - Belsize, blue is NTSLF as the red run of 01 Nov pm.
All overlaid on the same time axis.
P,L, 1 and 2 are the times of high tides at Portsmouth , Lymington and Soton HT1 and HT2. BelsizeP adrift over low tide there , so negative and below that plot.
Orange is simple inverse barometer at Soton.
The BBC TV weather graphics of that time showed wind going W-E along the channel not the wind from the south , shown on MetO and GFS isotachs.
Unknown why the NTSLF surge predictor is great at characterising secondary surges from NW wind etc via reflections off the French coast but underplays primary surges from wind from St Briuc to the Solent.
It was the same for the record surge of 26 Nov 1924 and surges on 28 Mar 2016 and 20 Nov 2016,but away from high tides times .
If the first wind peak surge was just half an hour later then perhaps a 5.7m total tide here at HT1 or 1/2 hour earlier for the second peak then a 5.55m HT2 here.
The EA alert for 02 Nov, followup. No specific mention of Priory Rd alert on EA Floodline or on wwww, weird www reference to flooding at Northam and Crosshouse.
Using floodassist database/archive
The designation Itchen Estuary seems to be new fangled.
AFAIK no marine flooding for Millbank since 1920s and Lower William St pumps installed, upgraded with large pumps in lower York St 1970s? and under the road pumps of the industrial estate. Some wave assisted water started to enter William St from the Shamrock Quay car park bund on a 5.5m? tide about 8 years ago, but gobbled up by the pumps.
Crosshouse ISTR marine flooding of Endle and Elm Streets before groundworks associated with the "New" Itchen Bridge mid 1970s.
So looks like the EA computer was delving into its archive to mention those areas for some odd reason.
If named areas should appear in more industrial inaction alerts, from analysing the floodassist records
In terms of level of potential flood, the first appearance of
"Priory Rd, residents ..." 5.04m total tide
Ashlett Creek... 5.14m "
Riverside Park... 5.18m "
Priory Rd (in main text)...5.29m "
Hythe High St.. 5.29m "
Shore Rd (Warsash)...5.29m "
Calshot Activity Centre.. 5.29m "
Fawley Refinery outbuildings 5.32m "
Boatyards at Swanwick.. 5.34m "
early Storm Ciaran 27-30 Oct 2023
The elevated local sea levels was probably the first such occassion where purely inverse barometer was enough to reach Belsize trigger level with next to no wind surge, stealth surges.
In the whole period the highest VTS wind recorded was just 23 knots,
over 5.4m 29 and 30 Oct on 4.8m astronomic tides.
Similar situation 08-09 Feb 2024
Continuing second-guessing EA flood alerts or two wrongs do make a right.
Like the ideal crib for decoding Enigma at Bletchley Park where a German lazily repeated a message without resetting his machine.
EA published an alert on 09 Feb and also 10 Feb for the same am 10 Feb tide. So trying 3 variants, Pompey NTSLF surge data on its own, height at 4 pixels earlier off the pompey plot to represent Soton and also the average of 4 pixels earlier timing off the pompey plot and 16 pixels earlier off the Bournemouth surge plot , the latter conflation was closest.
Giving an EA surge fudge factor of adding 0.21m for the first alert and
0.23m for the second, so average of 0.22m and pixel counting for future EA alerts until another such doubled up crib appears.
For the otherwise undisclosed Soton EA tide curve for such double figure ,"surge" and total tide Soton alerts , 2024 seems to be much worse than 2023, so I'm ditching the rolling average of 0.15m from last year.
For the 09 Feb am tide underplayed the astronomic tide by 0.24m and for 10 Feb , by 0.19m so the 2024 so-far rolling average of 0.215m, as Belsize tidecurve heights were correct for those days . So cancelled out by the fudge they are falsely adding to the NTSLF surge prediction, whilst retaining the out of data ,too low, tide-curve.
This week the EA dropped 3 decimal place data in their csv files , rounded rather than truncated to 2dp, for tide gauges 1020,1024,1028 and 1034, presumably nationally. I wonder if that is like VTS an attempt to disguise to the public , bad bubbler gauge data.
Pompey 1028 CSV files still have the EA and NTSLF tide gauge data , fuddled order so corrupt ie not true csv structure.
Repeat of this second-gussing exercise for the single EA alert for Soton timestamped 8pm 27 Mar for the 12:30 Soton tide 28 Mar , they had 4.40m as the underlying tide height and surge value of 0.91m to give total tide of 5.31m prediction.
Impossible to find anything like 0.91m residuals on the NTSLF plots even its peak pompey one of 0.86m at 7pm or the Bournemouth peak at 1pm. Using the -4 and -16 pixels off the timing of Pompey HT and reading off the red curves gave predicted residual for Soton off the pompey curve of 0.62m and off the Bournemouth plot 0.53m ,so average of 0.58m.
Going by Lymington (-0.15m) and pompey residuals the Soton tide height was near enough the Belsize height of 4.51m.
So EA had their tidecurve height as 0.1m too low and adding a fudge factor of 0.33m to the 0.58m "Soton" NTSLF prediction , to give near enough the correct total tide height prediction of 5.31m compared to actual 5.28m .
So rolling averages for the 3 such events in 2024 , EA tidecurve for Soton underplaying by an average of 0.18m and the fudge factor added to the suposed , for us pixel-counted, NTSLF residual of 0.26m
Second guessing EA fudge factor, update 18 Apr 2024
For the 8 EA alerts for Soton this year that disclosed their underlying HT height and surge levels for Soton.
Pixel counting off the NTSLF plots for Pompey and Bournemouth valid at the EA timestamp for each alert and choosing sets of data that gave the minimum spread of fudge values for each alert.
The best pairings so far, and so messy a process I'll leave at this.
Average of the NTSLF surge value at pompey HT (grey circles of their plots) and the surge value at Bournemouth at time of Pompey minus 1 hour or 6 pixels before the pompey high tide time.
It makes no sense other than minimises the fudge spread, but EA imlying their tidecurve is correct and NTSLF surge values are wrong , makes no sense either.
Taking the Belsize Soton tidecurve as being correct (QC checked weekly).
Belsize tide height higher than EA and differences; 0.11,0.11,0.24,0.06,0.12,0.13,0.18,0.20m
Average = 0.13m probably reflecting the change in local tidecurve since deep dredging of Southampton water, not updated at the EA.
EA Fudge factors
0.31,0.27,0.27,0.27,0.20,0.36,0.35,0.23m
Average= 0.28m
Difference 0.28 -0.13 =0.15m probably reflecting the mean sea level anomaly around the UK . The same value I'm using for the Lymington residuals (updated 08 June 2024 to 0.18m)and the much the same long term value to the RMS error at Newlyn for the NTSLF residuals difference between ( tidegauge minus tidecurve ) and predictions.
In other words for future EA alerts, whatever they give as "increases tide table values by", subtract 0.28m and adding to the Belsize Soton HT height should give much the same total tide height as quoted in their alert as "total forecast tide", perhaps.
Since the NTSLF 'glitch' of 29 Aug 2024.
Second-guessing the EA alert of 05 Jan for early am tide 06 Jan 2025, EA underlying tide height 4.39m ie 0.25m lower than Belsize and fudge factor on the average of the 4 and 16 pixel (Av of 0.70m and 0.52m) Soton NTSLF read off business, was + 0.27m to give the EA 0.88m residual forecast for soton.
Updating the EA alert fudges from the 2 alerts since 29 Aug 2024 NTSLF 'glitch'
06 Jan 2025 Belsize underlying tide 0.25m higher than EA and surge from the Po/Bournemouth (Po HT -4pixels,-16 pixels of time axis) average for Soton off NTSLF, 0.27m higher than NTSLF
27 Jan 2025, tide 0.21m and surge 0.29m
So average over 2 EA alerts
subtract 0.23m from Belsize for EA uderlying tide level and add 0.28m to the NTSLF surge plot implied Soton value for the EA total tide levels in their alerts
For the UK MSL anomaly, as of 18 Apr 2024, data from processing the NTSLF Newlyn forecast and tidegauge minus tidecurve RMS errors each 3 days. Green is the function included in the Belsize tidecurves as of mid 2023 and the red is the best fit to the latest Newlyn RMS error dataset, monthly up to mid 2023 and 3day beyond that.
From June 2024 processing , the Newlyn annual peak about 0.18m end of April 2024, next peak prediction 0.19m April 2025 and minimum later in 2024 of 0.17m.
On the "glitch" on the Newlyn NTSLF plot 02 Oct 2025.
It would seem to be recalibration of the gauge.
The most recent anomaly plot of RMS errors had been showing a change of character for a few months, the annual signal dropping out and increase accelerating. It seems the readings from 02 Oct 2025 are correct and a minimum of 7cm had to be removed from the rms errors.
Summary- the glitch/recalibration of 02 Oct agrees with the OS FB1520 benchmark at Newlyn. Although it may be drifting high again going by NTSLF Newlyn 1.3 plots as of end of Oct 2025.
The OS flush bracket , at least 50 years old, on a wall constructed as part of the South Pier (with the tidal observatory) in the 1880s and me using a Rabone Chesterman surveying tape about 40 years old, and 50 yearold optical auto-level.
The building on the right is the winch house for the slipway cradle and behind and below it relatively calm sea below a small public hard.
The convenient eye-level I made the top of the wall, clearing away ivy and brambles to place the pink sighting marker on the wall.
Pink marker 0.495m above the level reference of the ledge on the horizontal knotch of the trident mark , so in effect a hyphen between the O and S of the plate. Recorded OS level of 5.308m ODN , plus 3.05m conversion to 8.3058m Cd, giving eye-level of 8.853m Cd.
For the high tide at 17:00 20 Oct EA3156 level of 2.59m = 5.64m Cd
I did not use a stilling well as relatively calm, just one contact in the sea and another on the weighted survey tape and DVM and adjusting its length to the eye-level ,to half timewise conduct/half non-conduct.
Length of tape at HT 3.19m (1.26m to lower edge of winch-house concrete wall and 1.93m above that) so eye level by survey tape was 5.64+ 3.19= 8.83m Cd. So surprisingly only 2cm difference for which I'll declare that EA 3156, EA 1034 and EA1028 tide gauges all agree with surviving local OS benchmarks.
During my measurements they were using the high tide to lift a deep draught deep-sea going fishing boat out of the water, may well have moved the large concrete winch house during that process.
It was unfortunate they needed a high spring tide for moving a large fishing vessel up that Newlyn ramp, as I was taking readings. StreetView did not cover that area, and other untimed/undated pics always showed beach/drying ground in that public area behind the winch-house. So I had to choose a spring tide time to take readings. But if a next time for taking readings, I now know it could be off springs peaks and also there is a convenient small mooring eye to fix a temporary stilling well. I did not get to seeing what the situation is seaward of the Penzance "Tesco" EA3391 gauge. Perhaps EA remote or manual weir/sluice ,above or below the site confusing the monitoring, I'll have to check again on the next higher spring tides comparing to EA3156.
As a future calibration check on the Newlyn tidegauge, I'll try to remember at peak springs to monitor this EA gauge
https://check-for-flooding.service.gov.uk/station/3391
For the 2 weeks , so springs and neaps, of Soton tides 26 July to 09 Aug 2025.
No logging of Belsize Soton tidecurve being out by more than about 0.1m in that period, so taken as true reflection of the underlying tides.
Comparing to the NTSLF soton predictions.
Ranging from ntslf too low by 19 to 48cm and average of 32.4cm
Contact name Nigel Cook
A reserve email account is scicafsoton(commercial at)gmail.com
Please make emails plain text only , no more than 5KByte or 500 words.
Anyone sending larger texts or attachments such as digital signatures, pictures etc will have
them automatically deleted on the server. I will be totally unaware of this, all your email will be deleted - sorry, again
blame the spammers.